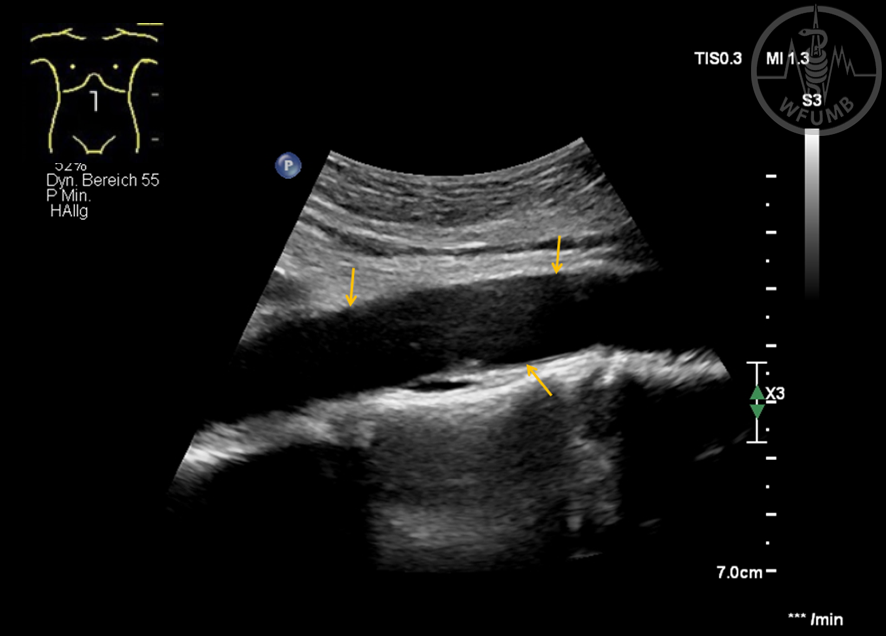
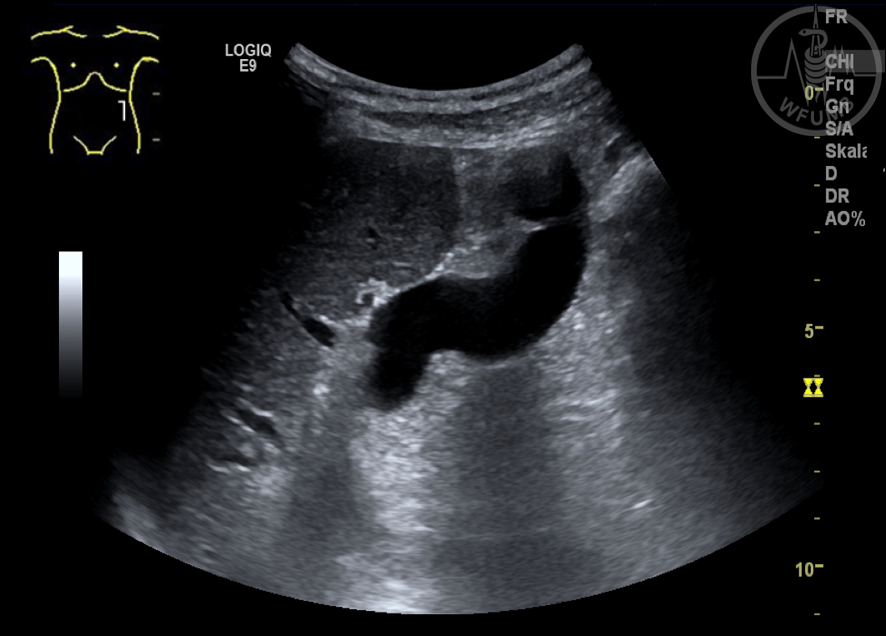
Fig 18.1
B-scan imaging: Normal abdominal aorta (yellow arrows) in sagittal plane
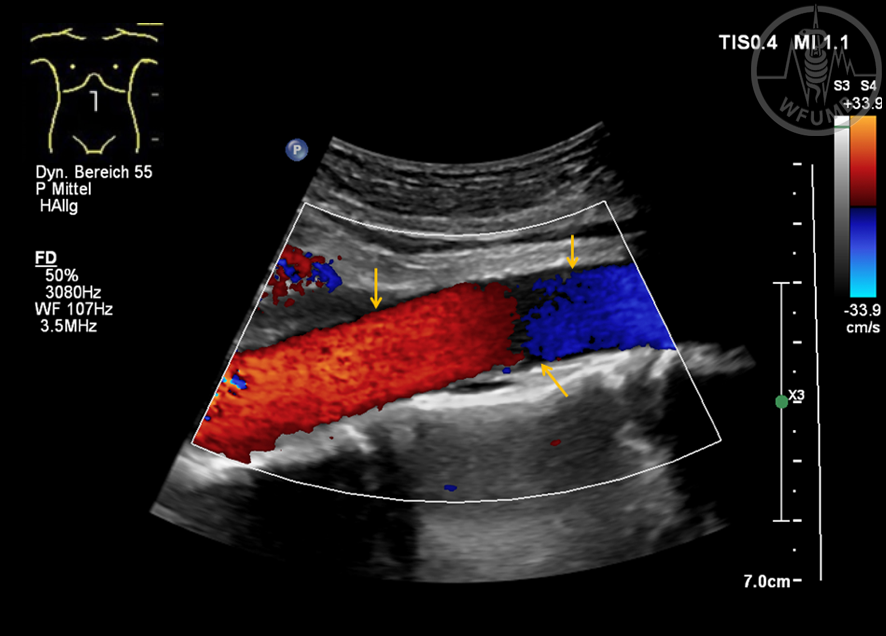
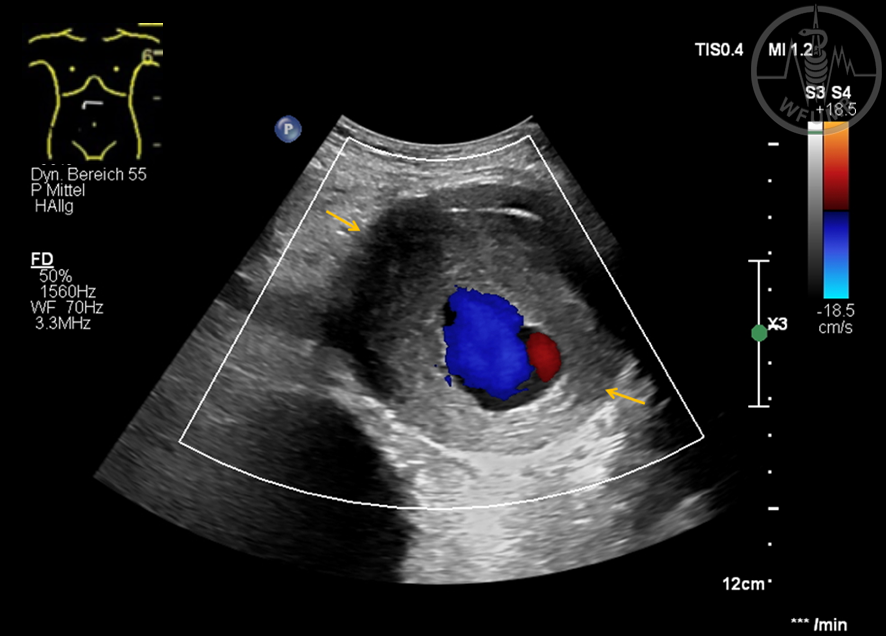
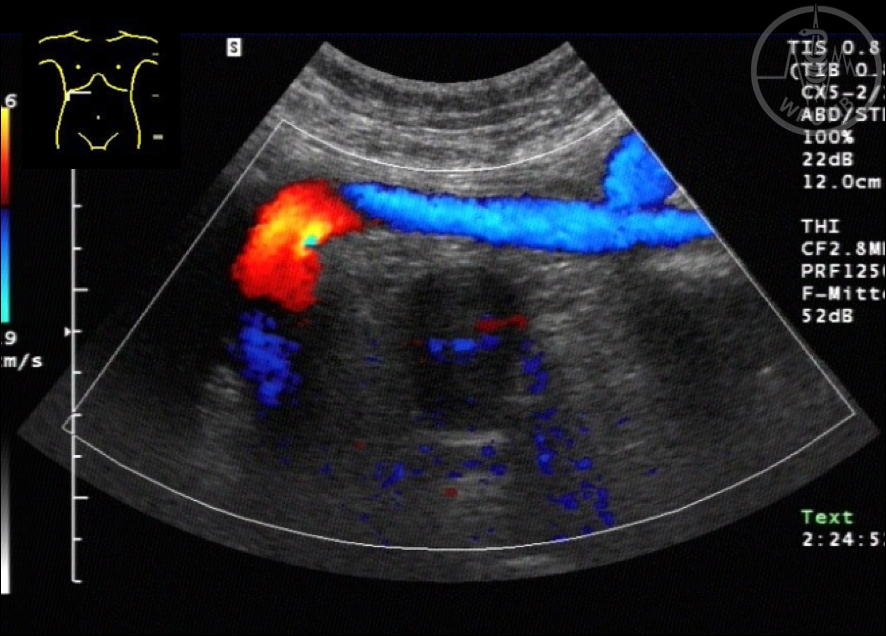
Fig 18.2
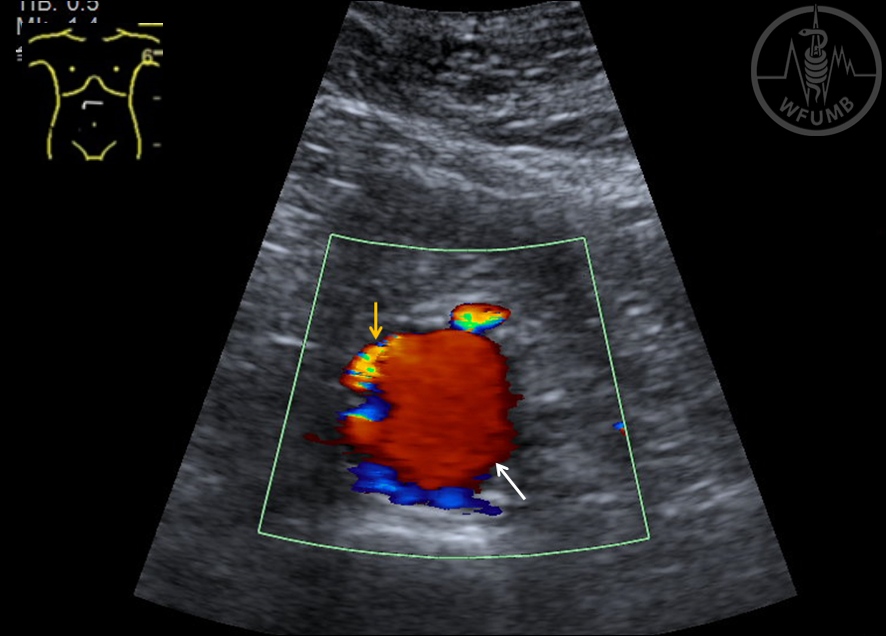
Color Doppler imaging: Normal abdominal aorta (yellow arrows)
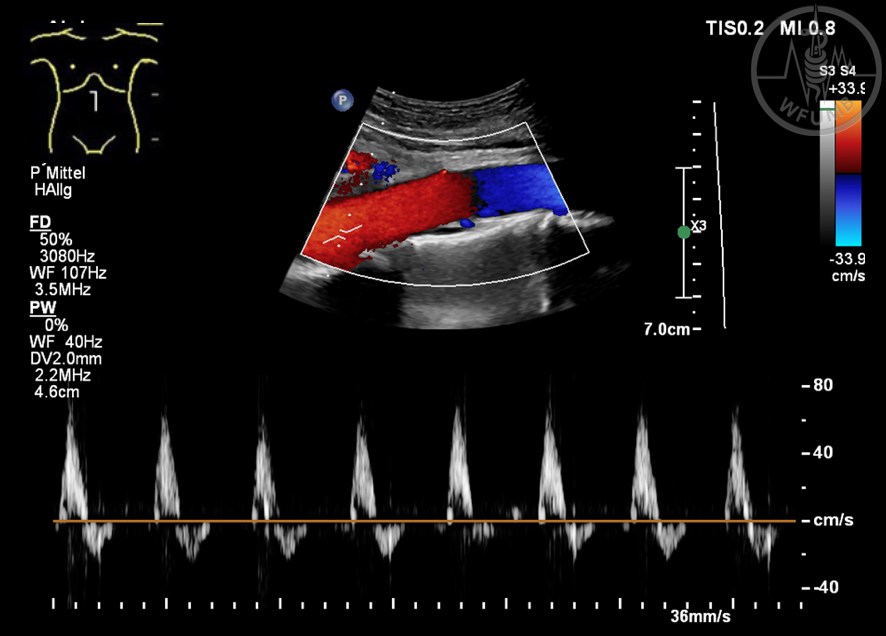
Fig 18.3
Normal findings of the abdominal aorta with proximal spectrum
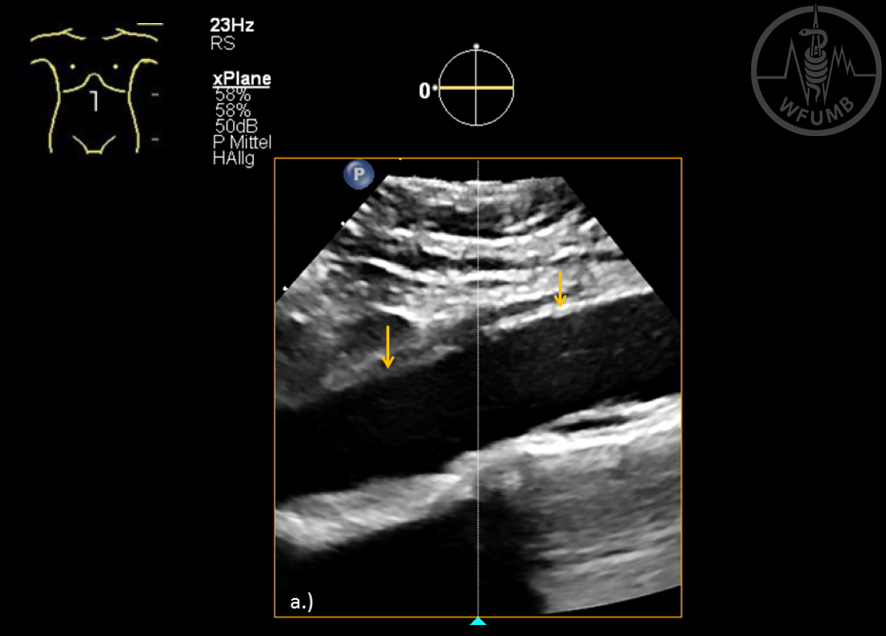
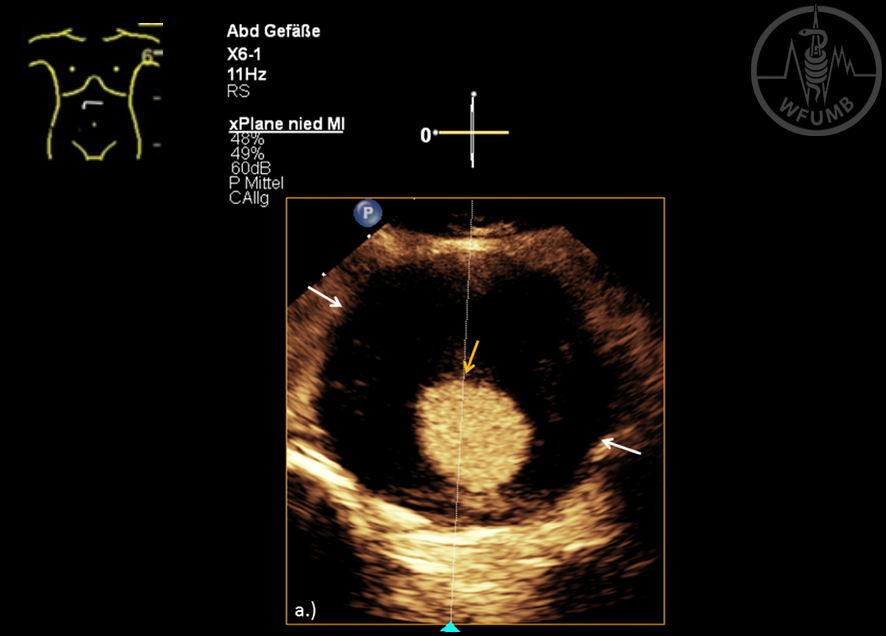
Fig 18.4a
B-scan imaging using x-plan setting: Normal abdominal aorta (yellow arrows) in sagittal plane
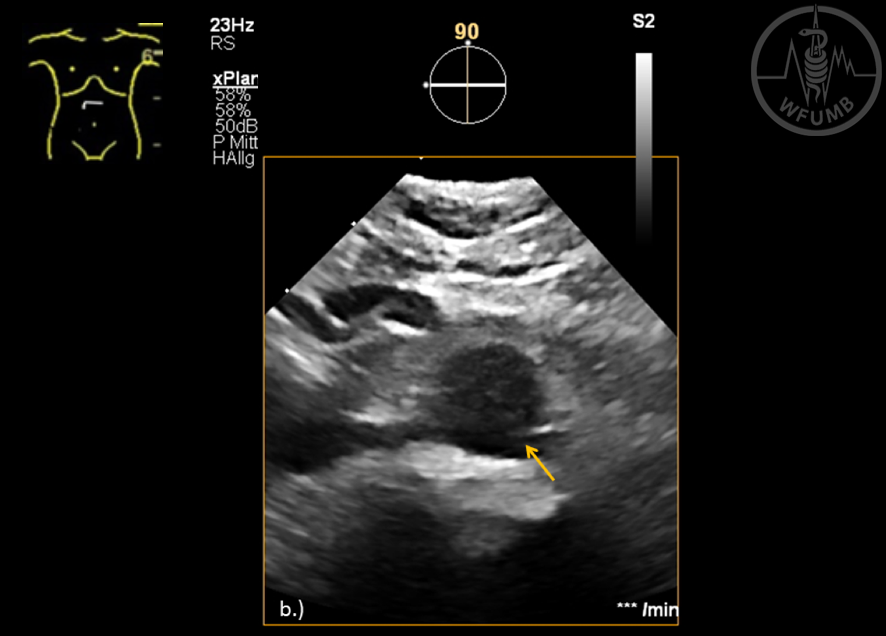
Fig 18.4b
B-scan imaging using x-plan setting: Normal abdominal aorta (yellow arrows) in axial plane
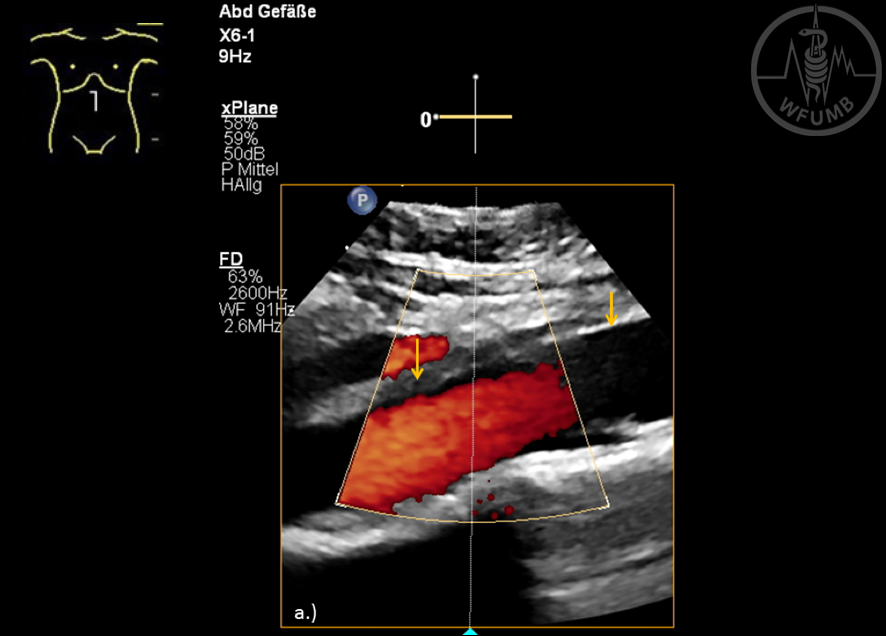
Fig 18.5a
Color Doppler imaging using x-plan setting: Normal abdominal aorta (yellow arrows) in sagittal plane
Fig 18.5b
Color Doppler imaging using x-plan setting: Normal abdominal aorta (yellow arrows) in axial plane
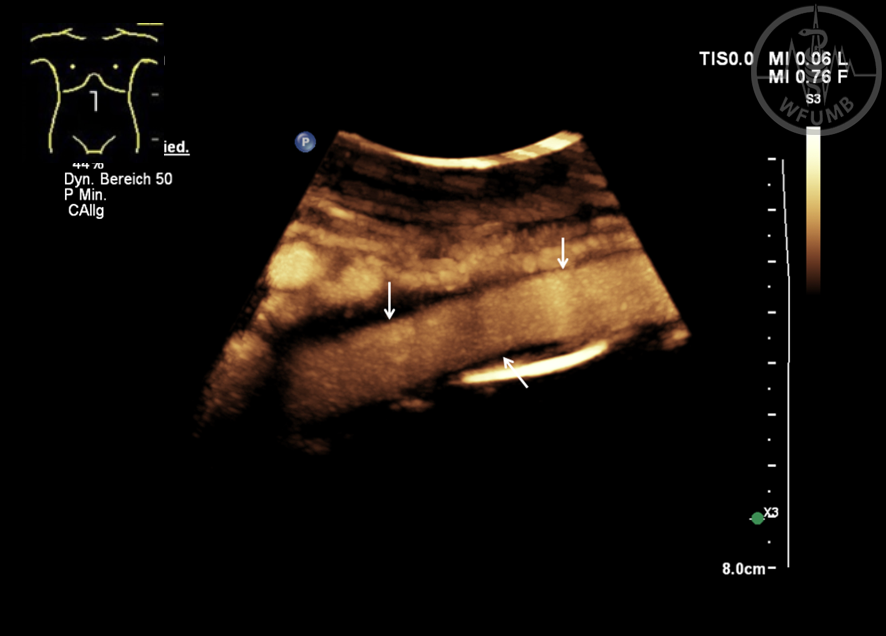
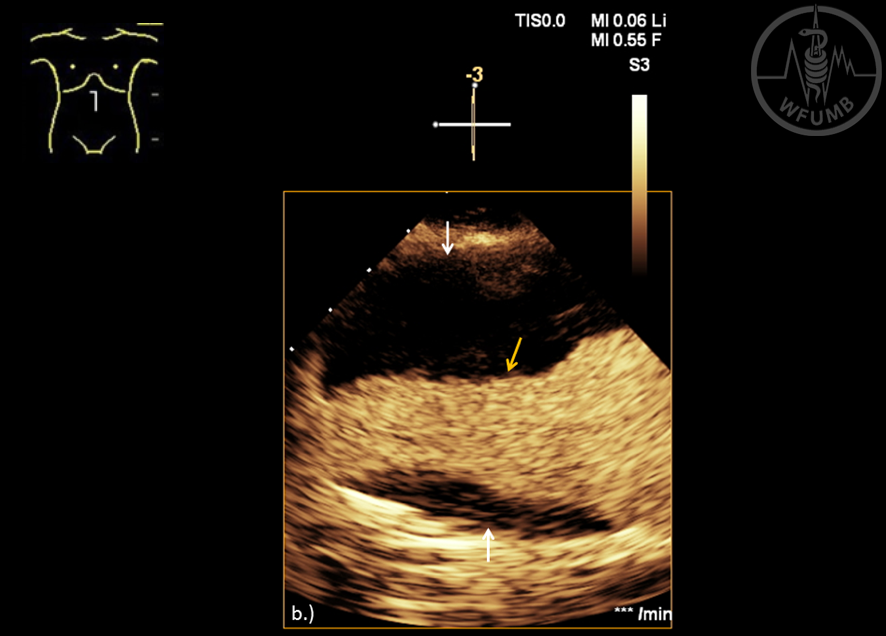
Fig 18.6
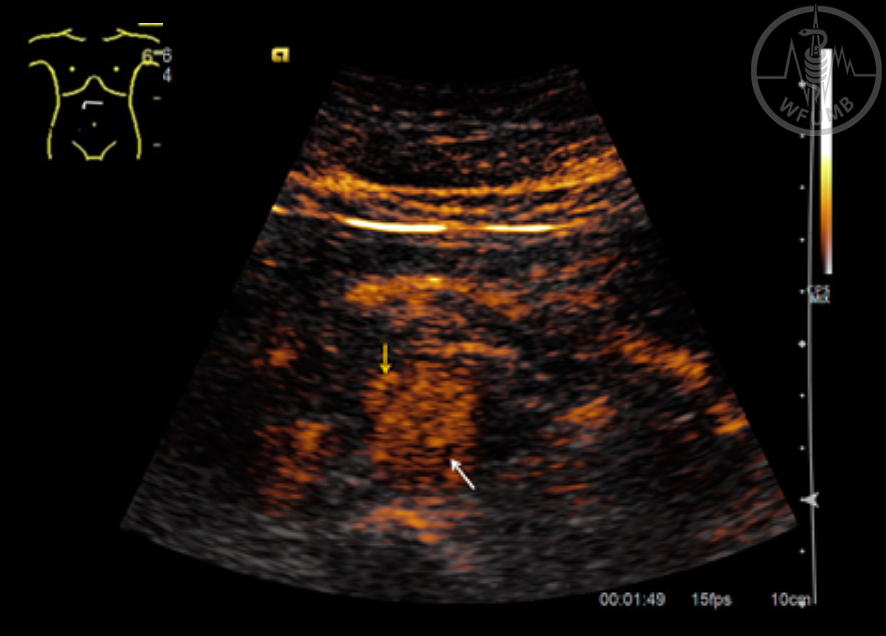
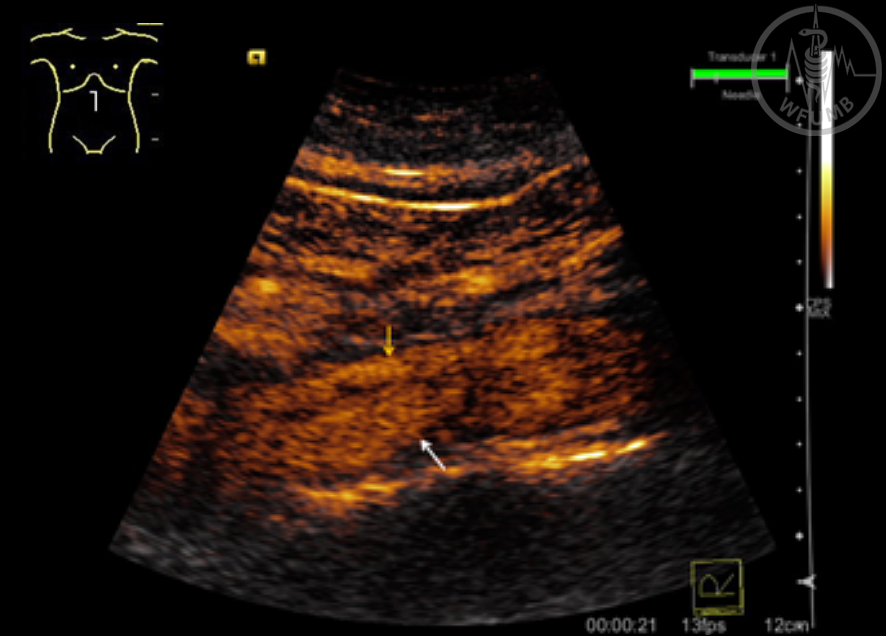
Contrast enhanced ultrasound: Normal abdominal aorta (white arrows)
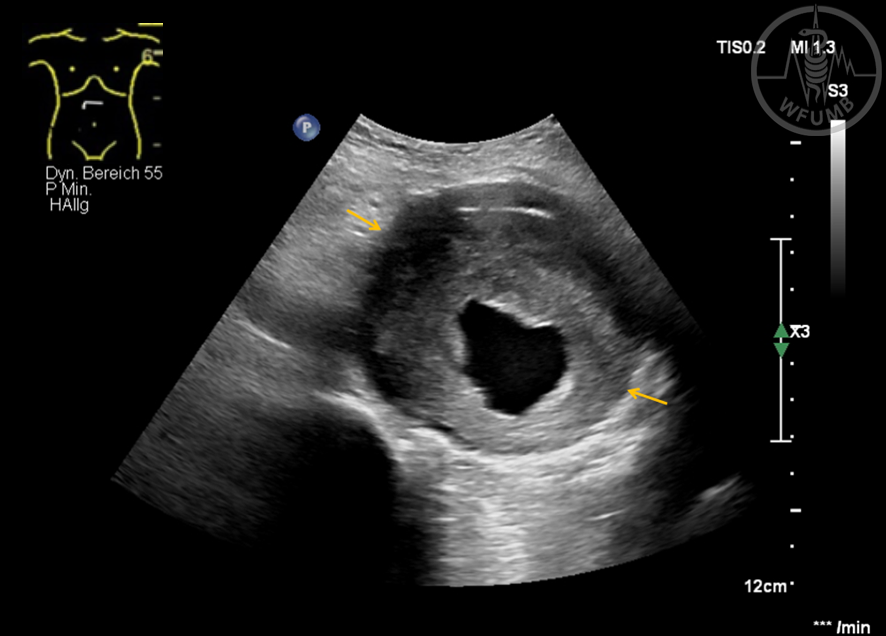
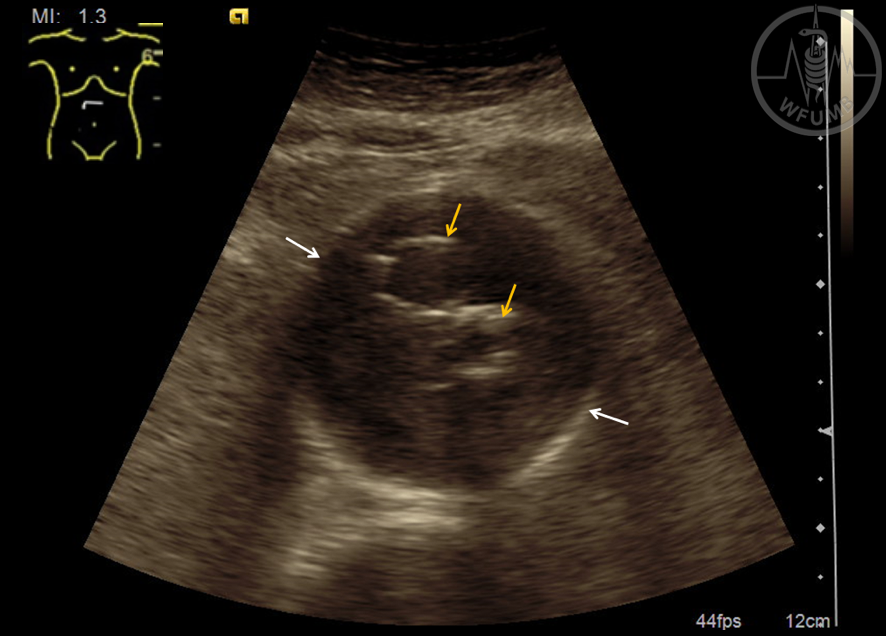
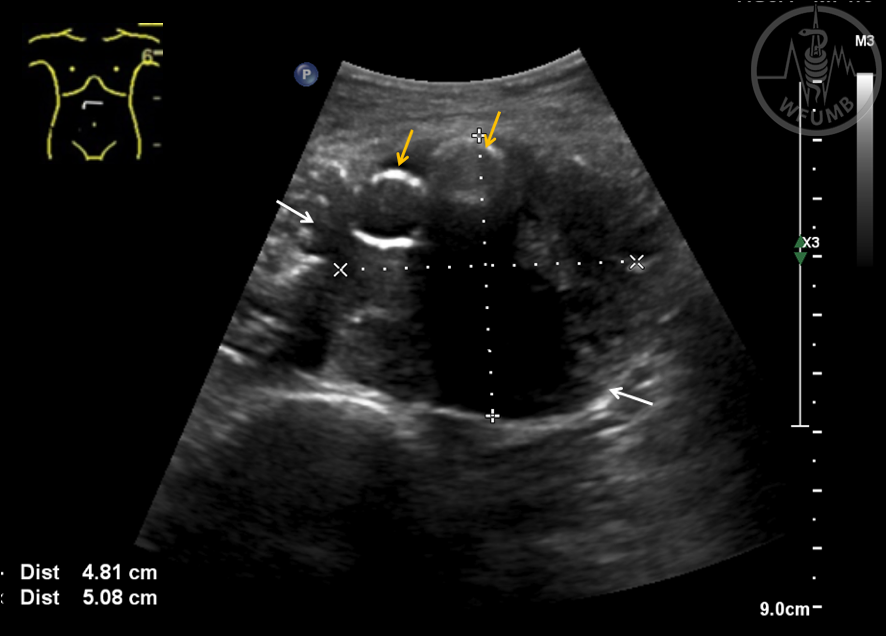
Fig 18.7
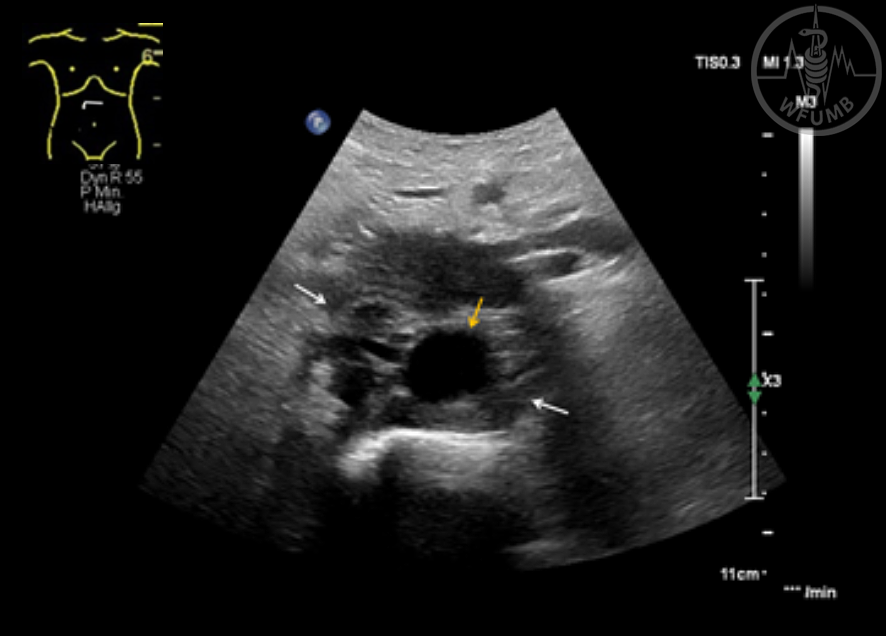
Cross-sectional B-scan of an infrarenal aortic aneurysm (yellow arrows)
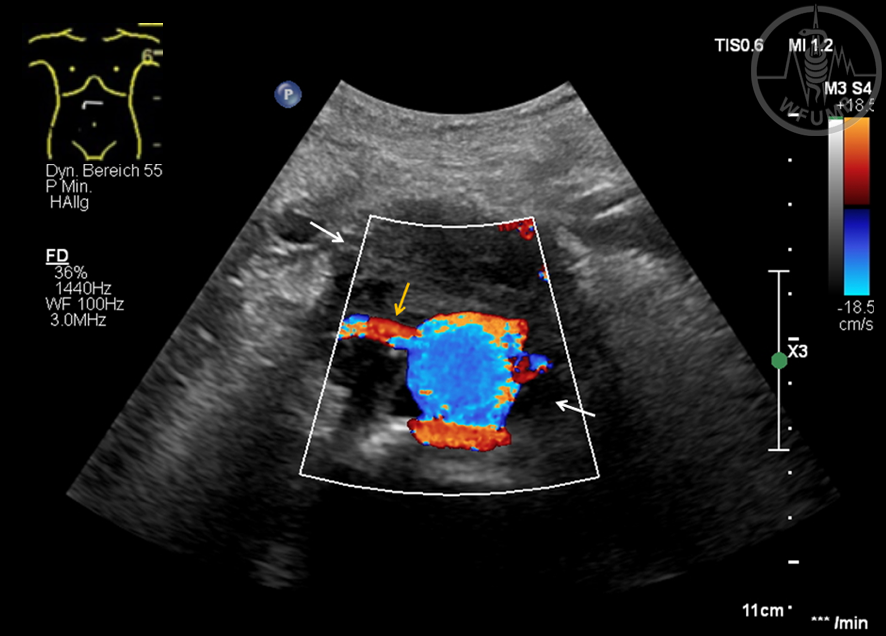
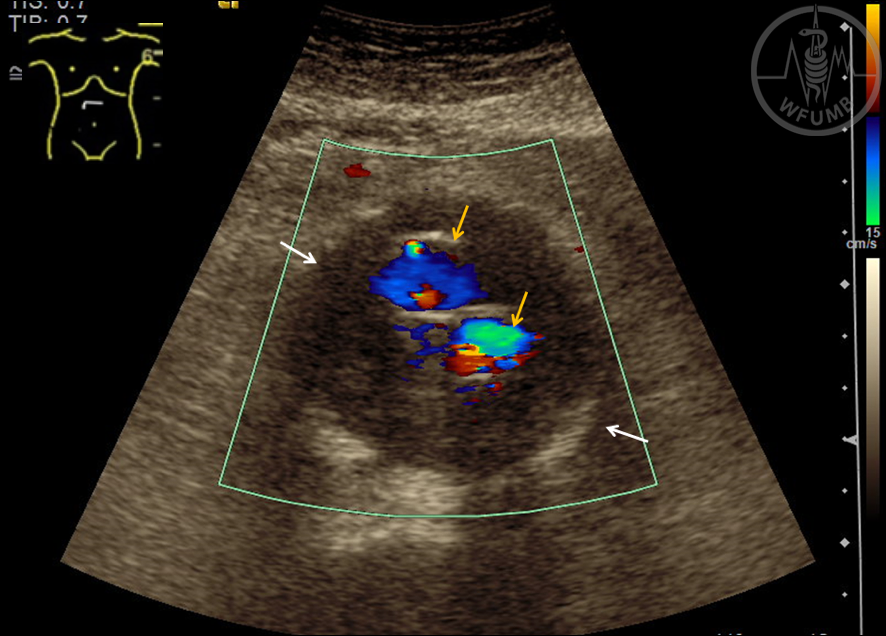
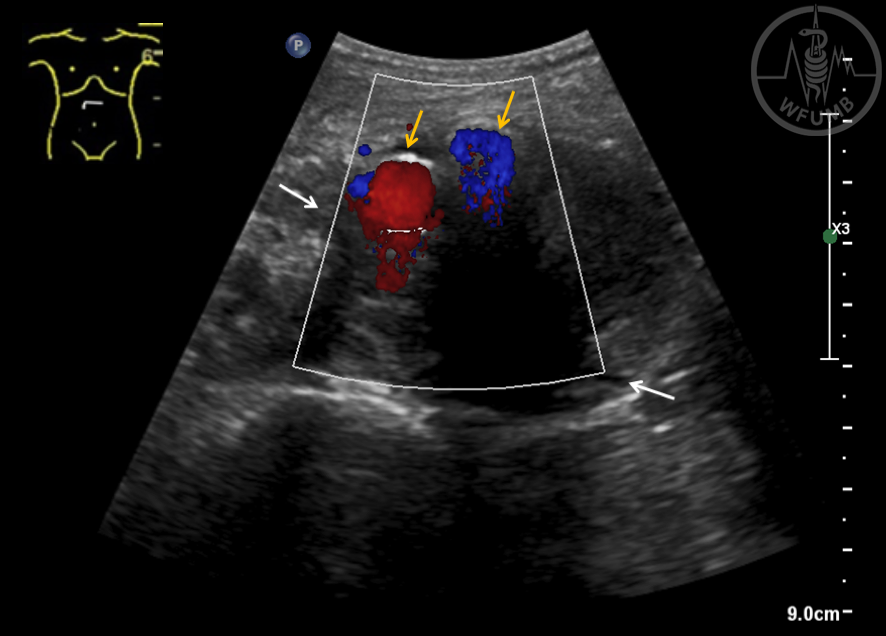
Fig 18.8
Cross-sectional color Doppler of an infrarenal aortic aneurysm (yellow arrow) with perfused lumen
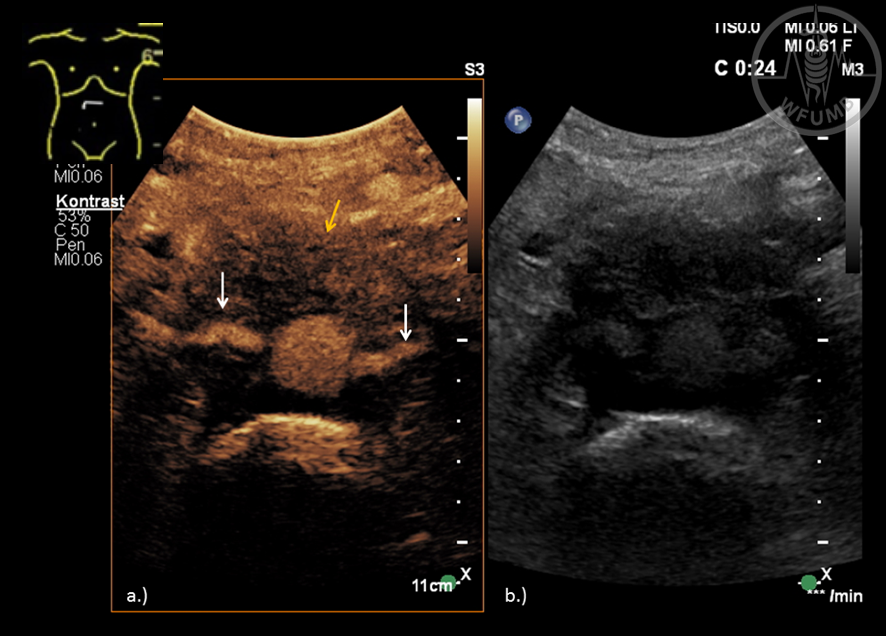
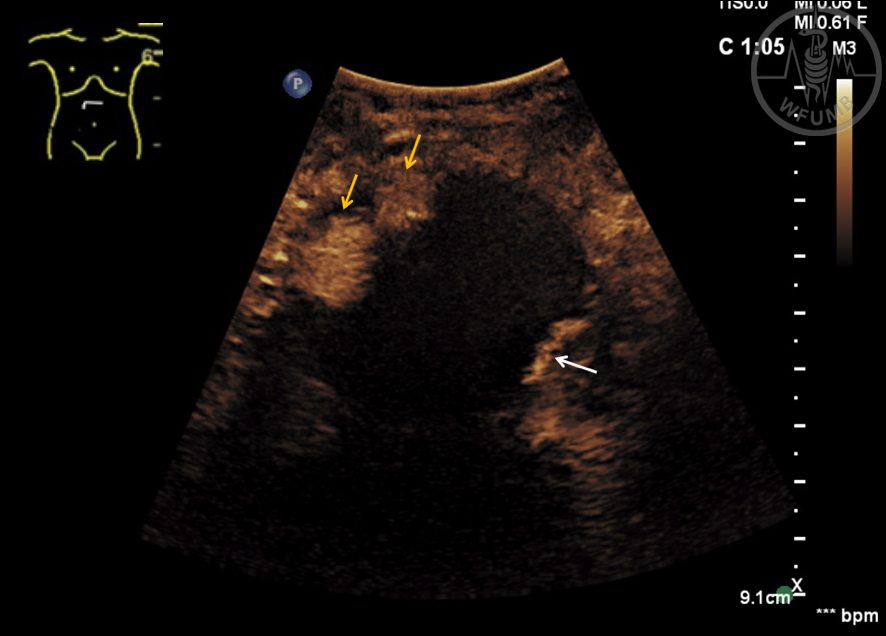
Fig 18.9a
Contrast-enhanced ultrasound using x-plan setting: Infrarenal aortic aneurysm (white arrows) and perfused Lumen (yellow arrows) in sagittal plane
Fig 18.9b
Contrast-enhanced ultrasound using x-plan setting: Infrarenal aortic aneurysm (white arrows) and perfused Lumen (yellow arrows) in axial plane
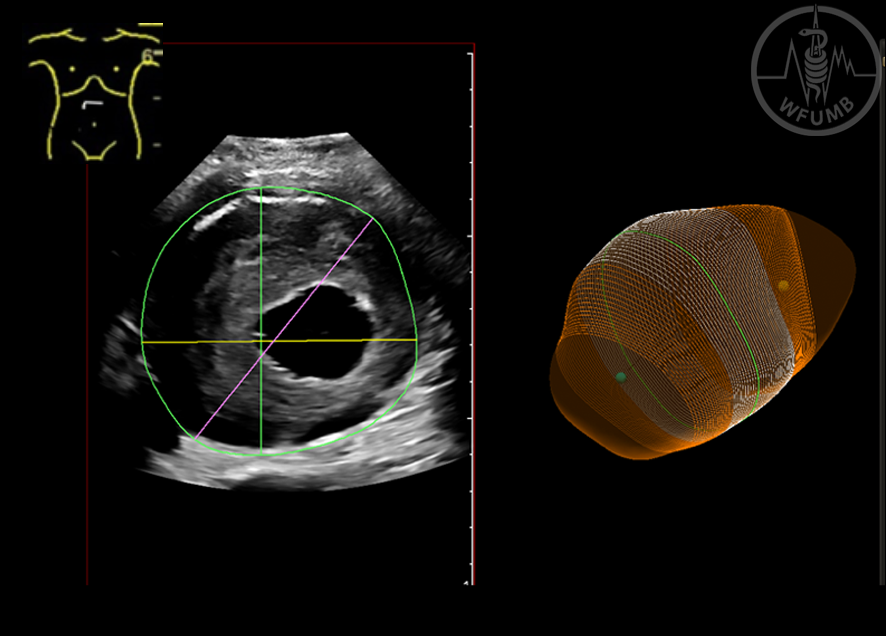
Fig 18.10
3-D B-scan imaging with automatically calculation the aortic aneurysm. The following parameters were calculated like AP-diameter, LAT-diameter, max. diameter and aneurysmal volume
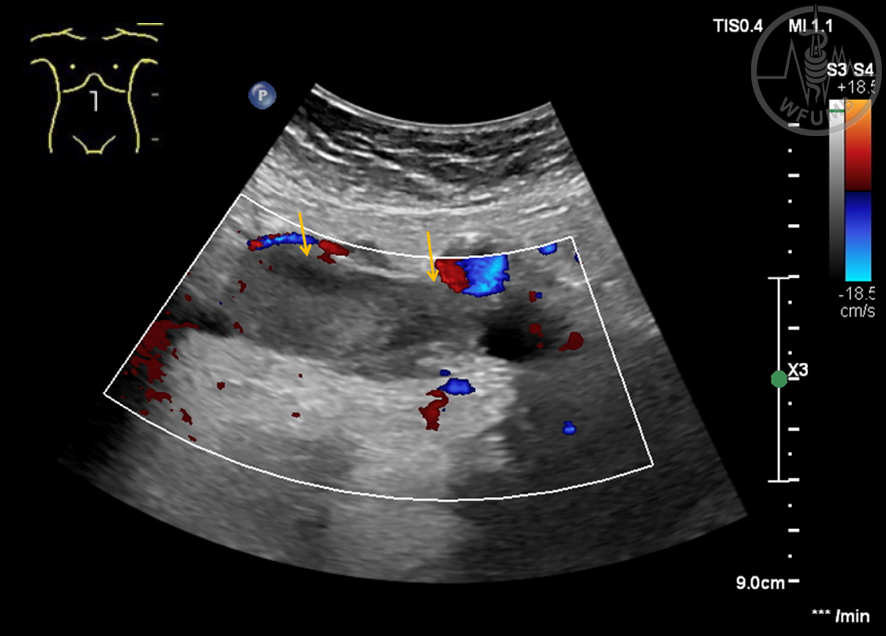
Fig 18.11
Cross-sectional of the abdominal aorta (white arrow), in Color Doppler examination suspicion of an aortic dissection (yellow arrow)
Fig 18.12
CEUS axial plane, demonstrating perfusion of true lumen (yellow arrow) in the early arrival of aortic dissection, and less enhancement in the false (white arrow) lumen
Fig 18.13
Longitudinal-sectional image with complete perfusion of true (yellow arrow) and false lumen (white arrow). Additional the aortic dissection flap is visible
Fig 18.14
Cross-sectional B-scan of the aorta (yellow arrow), with soft tissue completely surrounding the abdominal aorta (white arrows)
Fig 18.15
Cross-sectional Color Doppler imaging of the aorta with soft tissue completely surrounding the aorta (white arrows) also including visceral vessels such as the right renal artery (yellow arrow)
Fig 18.16
Cross-sectional contrast enhanced ultrasound imaging of the aorta using split image setting (a, b) - surrounding soft tissue with contrast uptake (yellow arrow) also including visceral vessel such as the right and left renal arteries (white arrows)
Fig 18.17
Cross-sectional B-scan view of an abdominal aortic aneurysm (white arrows) after EVAR (yellow arrow)
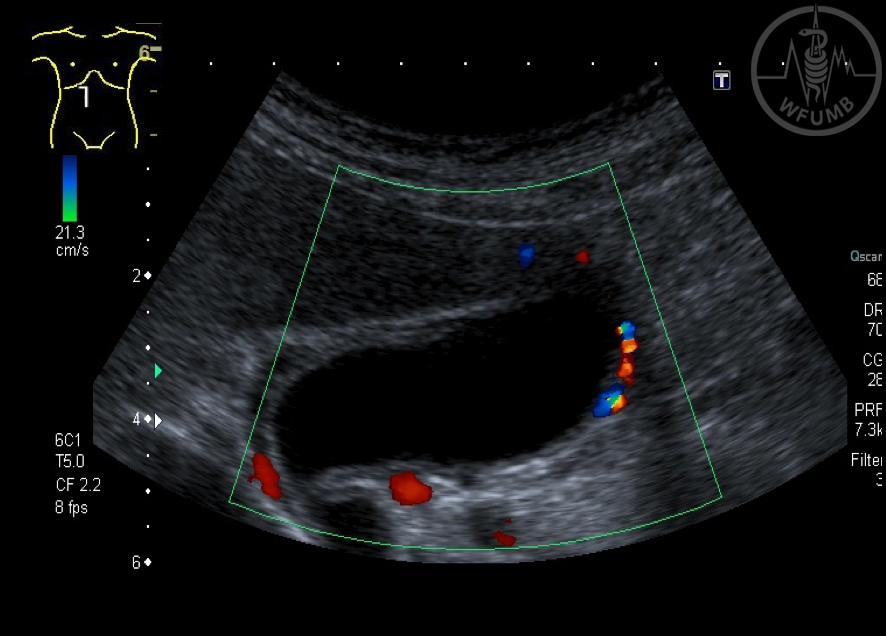
Fig 18.18
Cross-sectional view of an abdominal aortic aneurysm (white arrows) after EVAR. Color Doppler imaging (yellow arrows). No endoleak is detected
Fig 18.19
Cross-sectional B-scan view of an abdominal aortic aneurysm (white arrows) after EVAR (yellow arrow)
Fig 18.20
Cross-sectional view of an abdominal aortic aneurysm (white arrows) after EVAR. Color Doppler imaging (yellow arrows). No endoleak is detected
Fig 18.21
Contrast enhanced ultrasound in cross-sectional showing an abdominal aneurysm, the perfused stent graft (yellow arrow) and the endoleak (white arrow). The endoleak is a type II endoleak (white arrows) over the left lumbar artery
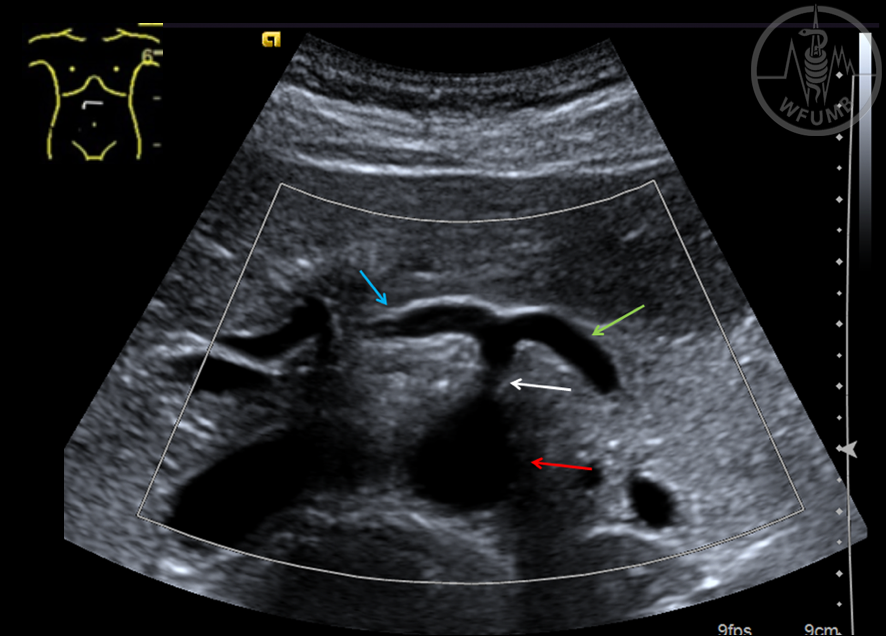
Fig 18.22
Cross-sectional B-scan
view of the abdominal
aorta (red arrow) and
coeliac trunk (white arrow) with its two branches, common hepatic artery
(blue arrow) and splenic artery (green arrow) illustrating the “Sea gull sign”
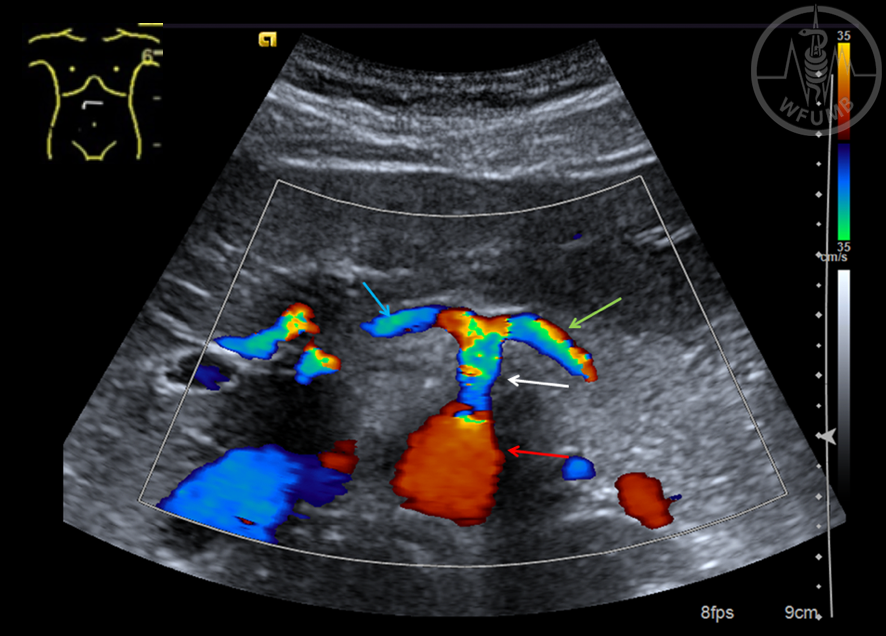
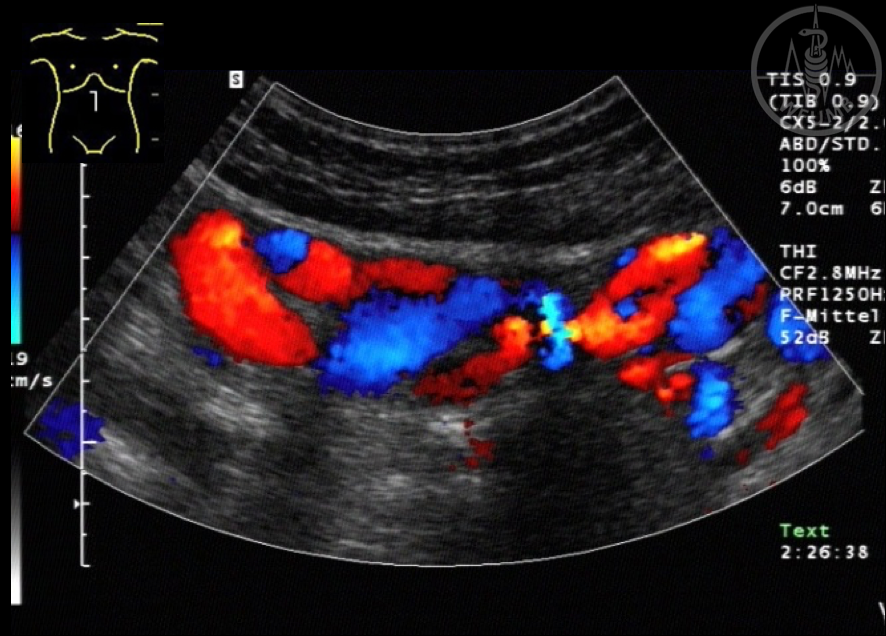
Fig 18.23
Cross-sectional Color Doppler image demonstrates normal homogenous color flow pattern of the abdominal aorta (red arrow) and celiac trunk (white arrow) with its two branches, common hepatic artery (blue arrow) and splenic artery (green arrow)
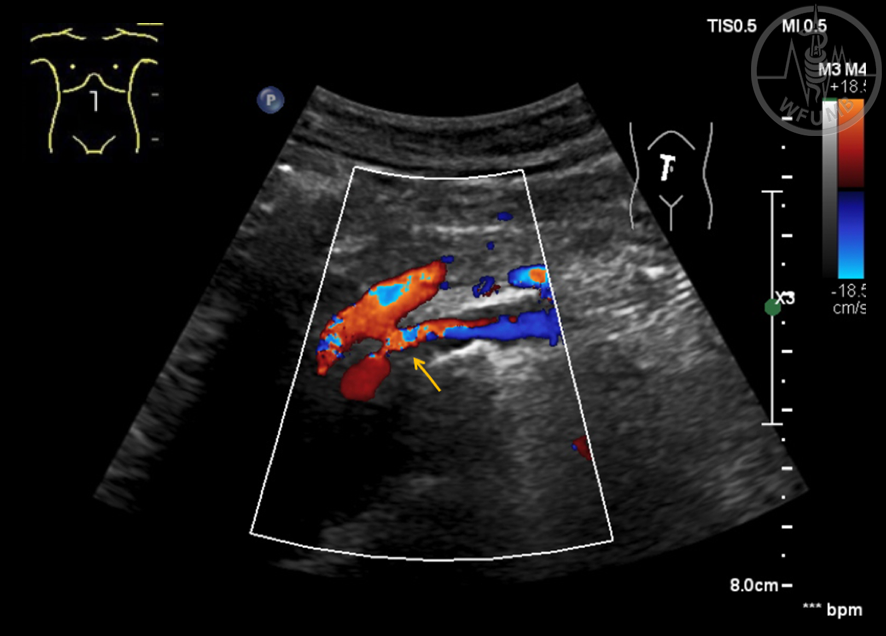
Fig 18.24
Longitudinal-sectional Color Doppler imaging of the superior mesenteric artery (yellow arrow), the lumen is minimized in diameter
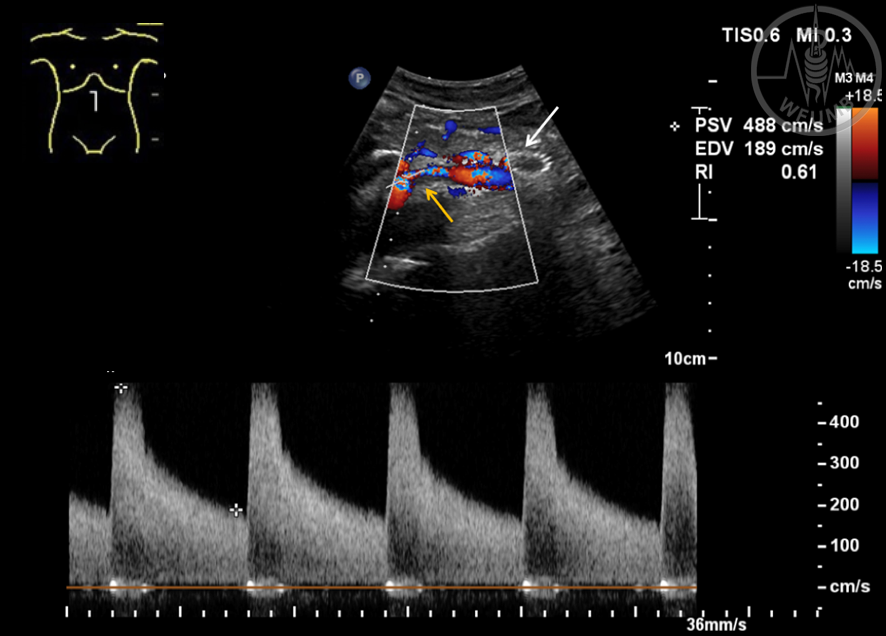
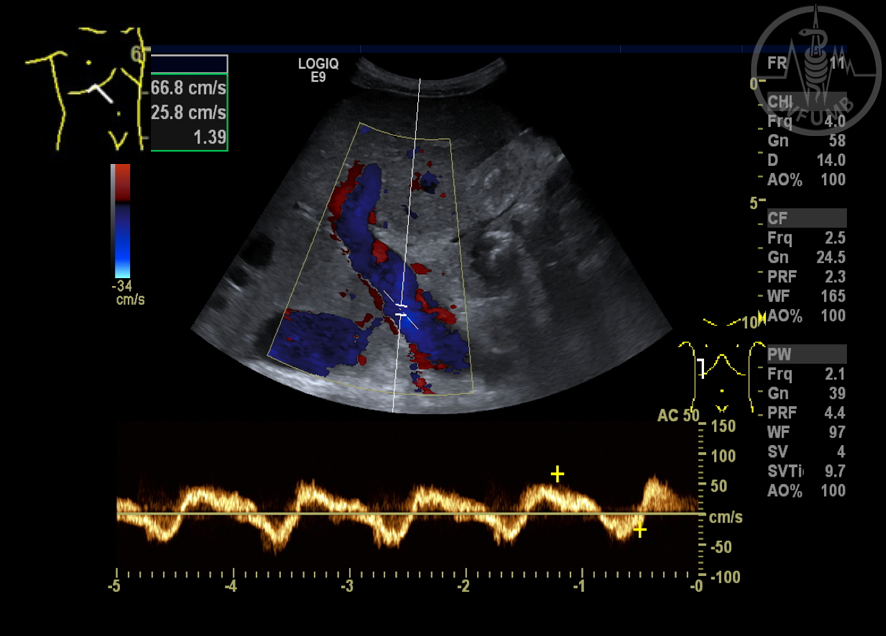
Fig 18.25
Same patient as in figure 18.24. Longitudinal-sectional Color Doppler imaging of the superior mesenteric artery (yellow arrow) with increased velocity (> 450 cm/s) as an indirect sign of a severe stenosis. Additionally, the patient had previously received a stent graft of the superior mesenteric vein (white arrow)
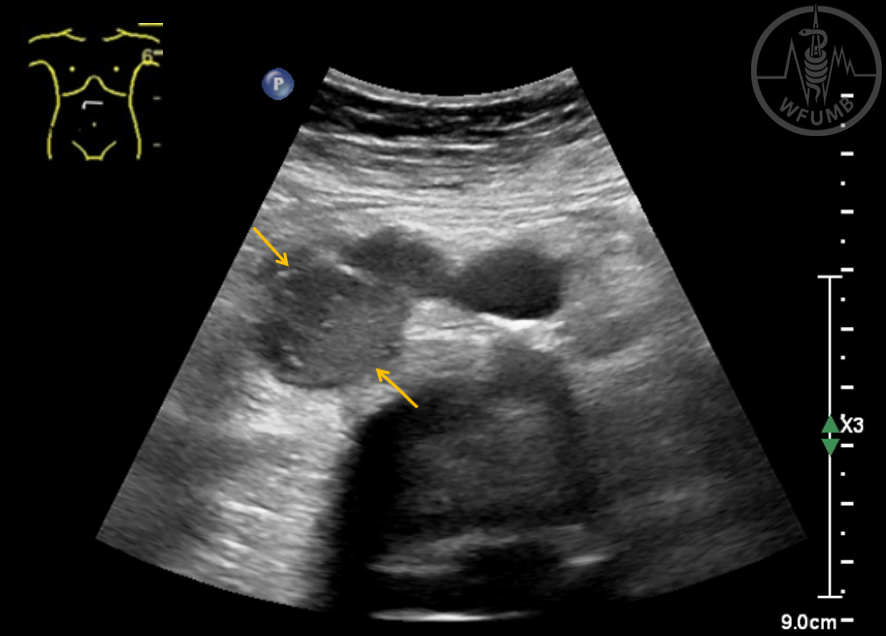
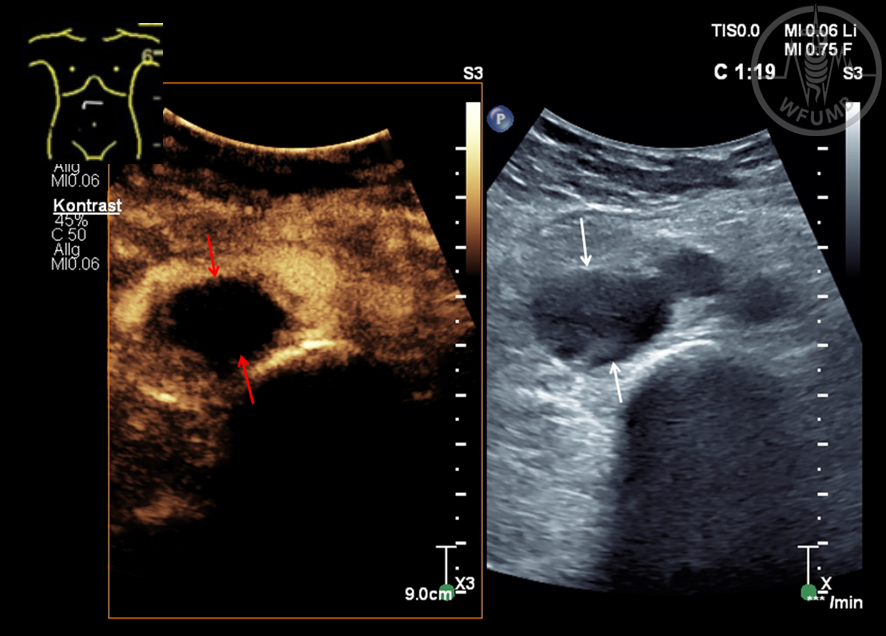
Fig 18.26
Cross-sectional B-scan view of the inferior vena cava (IVC (yellow arrows) with a fresh intraluminal thrombosis, which appears as echo-poor, an enlargement of the original IVC diameter can also be seen
Fig 18.27
Longitudinal-sectional Color Doppler imaging of the IVC (yellow arrows) with fresh intraluminal thrombosis which appears as echo-poor, an enlargement of the original IVC diameter can also be seen
Fig 18.28
Cross-sectional CEUS of the IVC using split image setting (a, b). CEUS shows the IVC with no contrast uptake of the thrombus (red/white arrows)
Fig 18.29
Longitudinal B-scan imaging view of the IVC (white arrows) with an extension of a renal cell carcinoma into the inferior vena cava (yellow arrow)
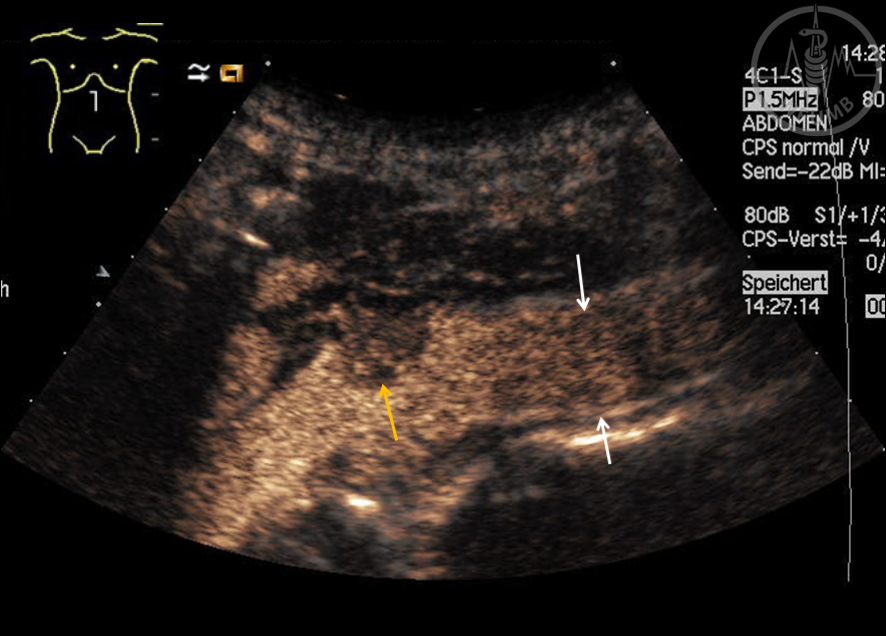
Fig 18.30
Longitudinal contrast enhanced ultrasound imaging of the IVC (white arrows) showing the inferior vena cava and contrast uptake of the thrombus in the early arterial phase (yellow arrow)
Fig 18.31
Longitudinal contrast enhanced ultrasound imaging of the IVC (white arrows) showing the contrast uptake of the inferior vena cava and wash-out of the tumor thrombus (yellow arrow)
Fig 18.32
Transversal scan in upper abdomen shows the dilated V. lienalis to more than 10 mm (arrows) which shows no variability during respiration
Fig 18.33
The Color Doppler (CD) signal in the portal vein (PV) is blue, the blood flow is hepatofugal – a sensitive sign of reversion of blood flow and progressive PH
Fig 18.34
In longitudinal section on the left side (axillar line), below the spleen, an enlarged tortuous vessel is visible – spleno-renal shunt in PH
Fig 18.35
On the left side of the image, vena umbilicales with hepato-fugal flow (red color) emerged from the liver (Cruveilher- v. Baumgarten syndrome) and goes down inside of abdominal wall in the direction of the navel
Fig 18.36
Inside of the abdominal wall (longitudinal section on the median line) a twisted conglomerate of vessels is visible – an internal caput medusae, a collateral convolute in PH
Fig 18.37
A seldom variant of collaterals in PH are gall bladder wall collaterals
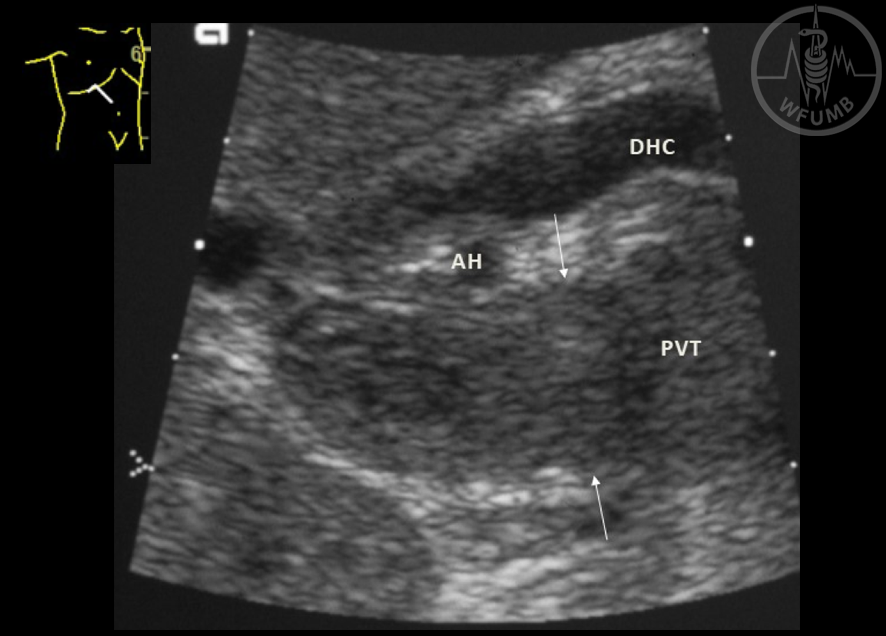
Fig 18.38
The portal vein (PH) is completely filled with echogenic material (between arrows) – sign of longstanding thrombosis (PVT). Oblique section in the right upper abdomen (DHC = Ductus hepaticus communis, AH = A. hepatica)
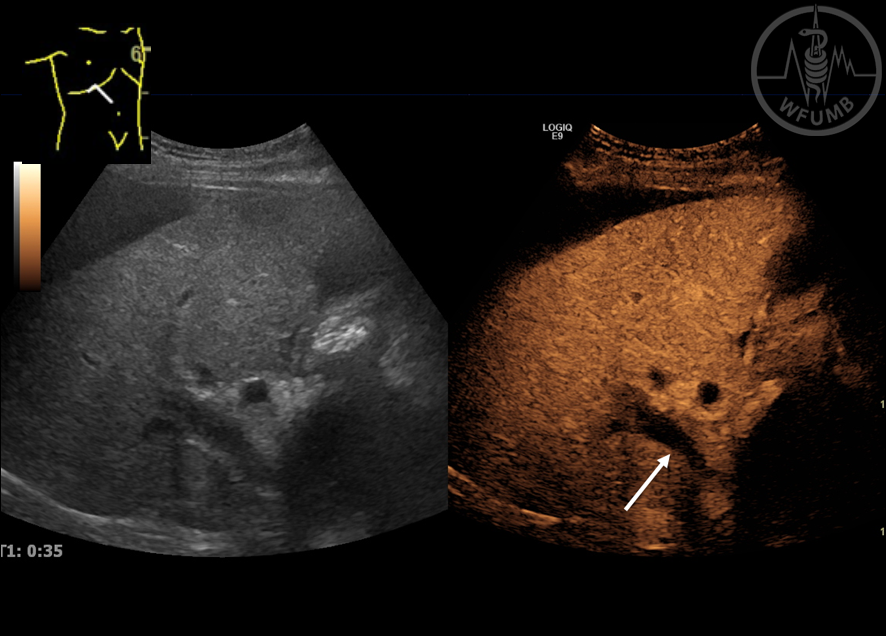
Fig 18.39
on left side PV is free of echoes, but in CEUS (right side) no enhancement is seen inside the PV. That means that there is no blood flow in an acute PVT (arrow)
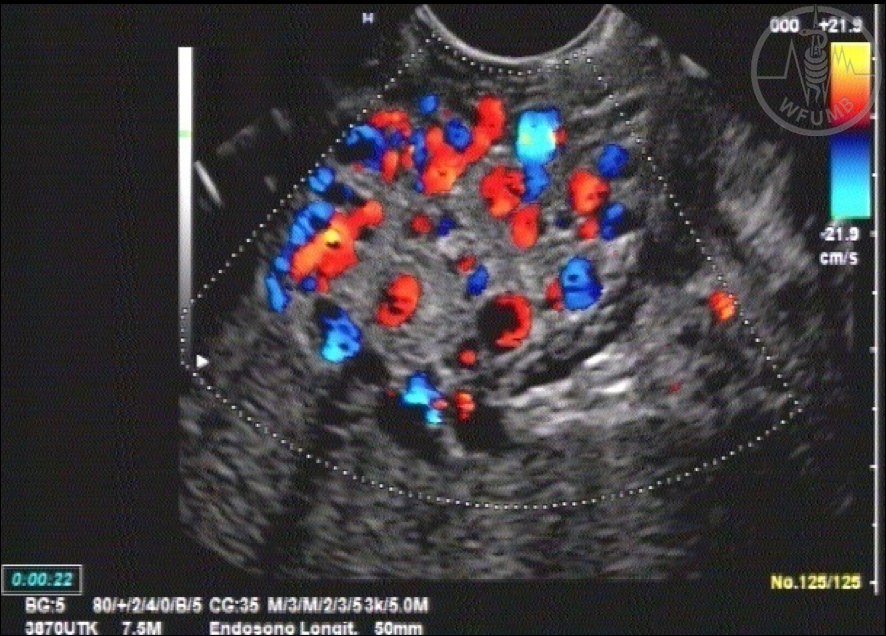
Fig 18.40
Transversal cut of a PVT (EUS view from stomach). Inside the echo rich thrombus a lot of colored small vessels (collaterals) are visible. Typical picture of PV cavernoma