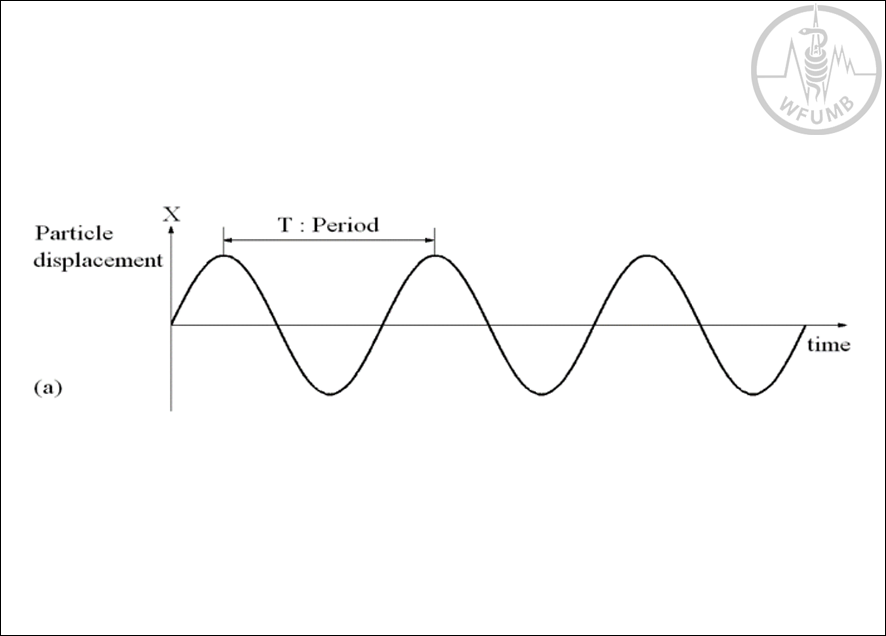
Fig 2.1a
Diagram showing the sound waveform in time and the corresponding period (T). The formula for period is: T (period) = 1 / f (frequency)
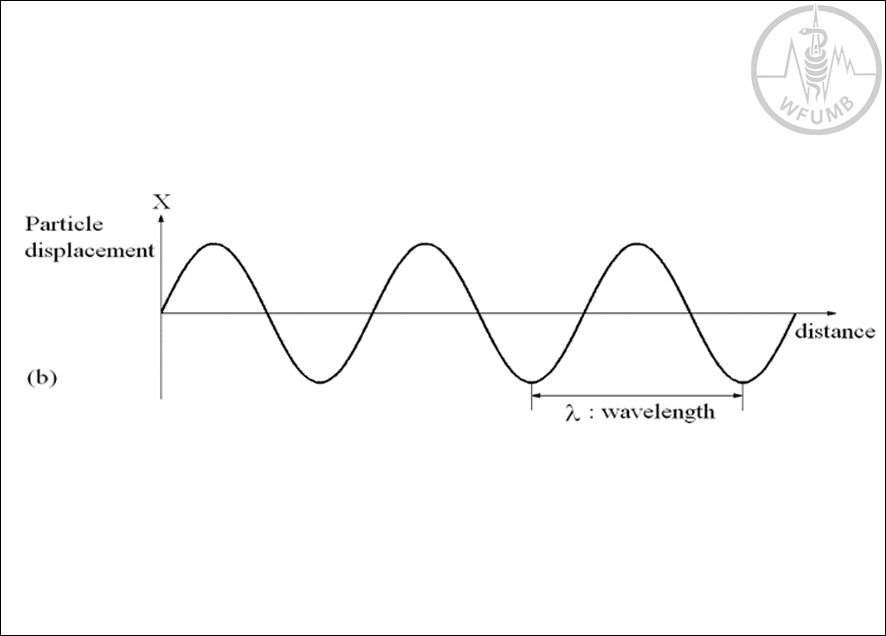
Fig 2.1b
Diagrams showing the sound waveform in space and the corresponding wavelength (λ)
Fig 2.2
Expansion and contraction of the PE material: a) The PE material in the equilibrium state. b) The PE material expands in thickness when the negative charge is applied to the left and the positive charge to the right. c) The PE material contracts in thickness when the positive charge is applied to the left and the negative charge to the right
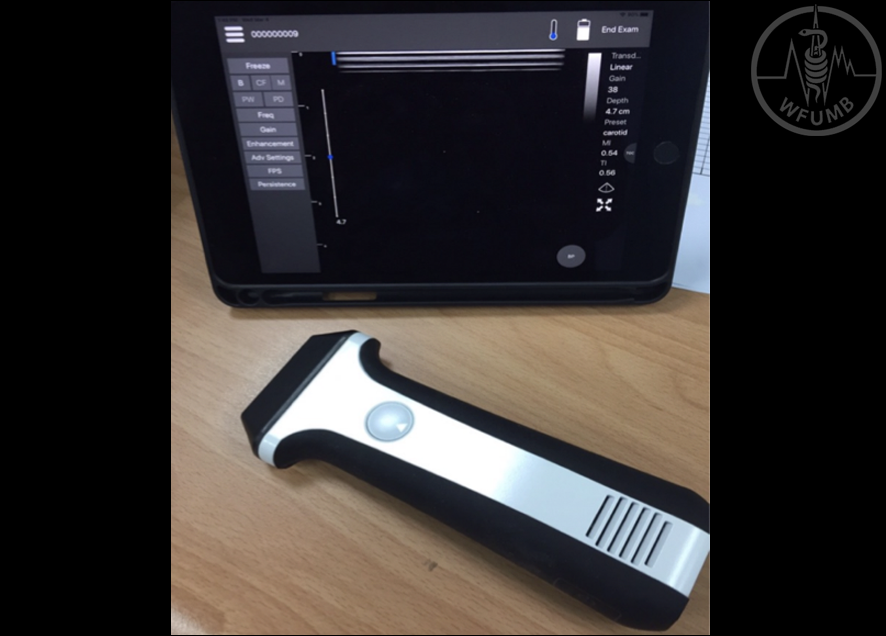
Fig 2.3
Example of a wireless PoCUS device where the integrated transducer with beamforming circuits does not require any cable for interconnection. The US image can be displayed by an external tablet running a customized application software (LeSONO, courtesy of Leltek Inc., Taipei, Taiwan)
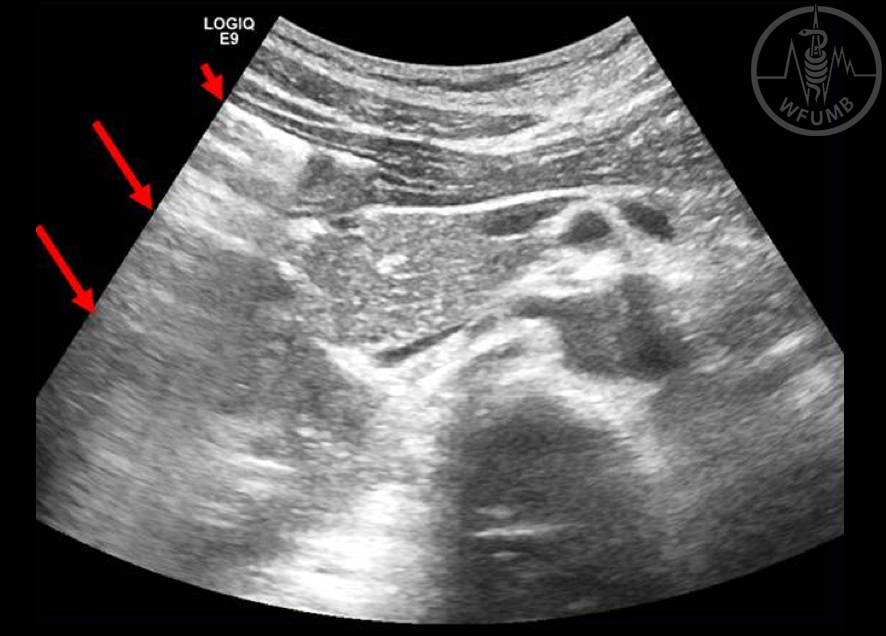
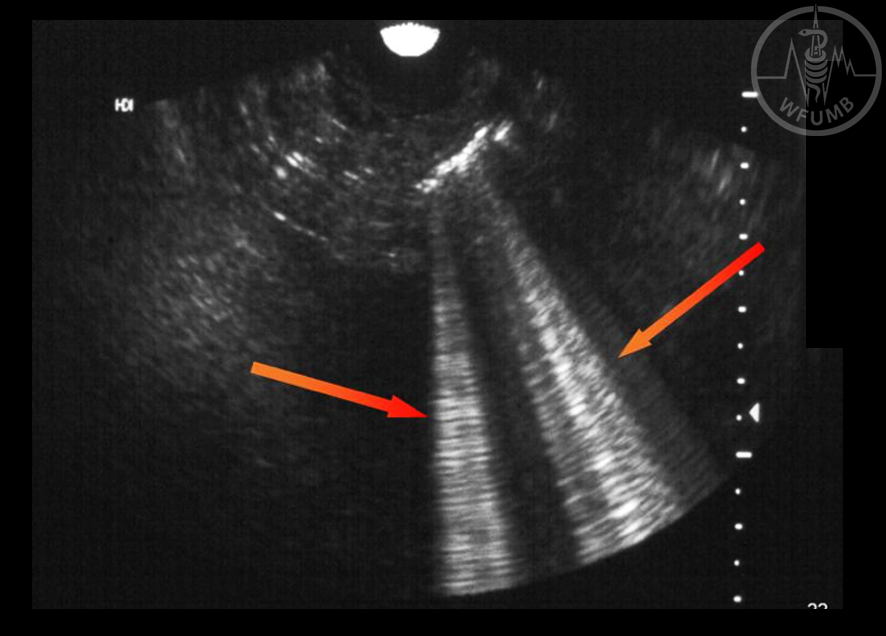
Fig 2.4a
Reverberation artifacts are caused by multiple reflections. They can occur between the transducer and a strong reflector (e.g., lung, bowel gas, or metallic material). Reverberation when scanning the normal lung, also known as “A line” (small arrows=normal lung as a real reflector, large arrows = reverberation artifacts)
Fig 2.4b
Reverberation artifacts are caused by multiple reflections. It can occur between the transducer and a strong reflector (e.g., lung, bowel gas, or metallic material). Upper abdominal US, transverse scans: Air in the stomach antrum (small arrow) causes reverberation artifacts (large arrows)
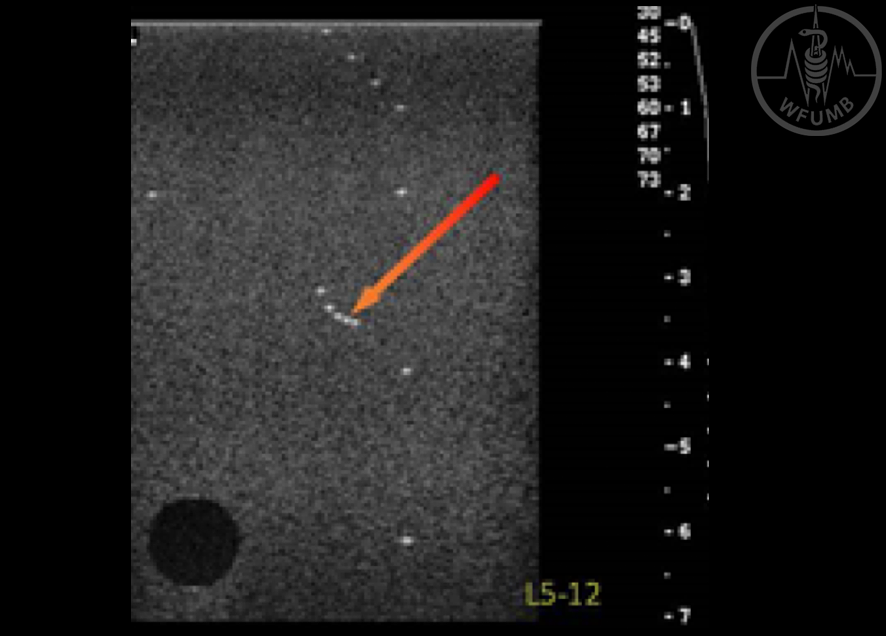
Fig 2.5a
Comet-tail artifact is a form of reverberation and resonance. A case of mild hydronephrosis with crystals in the dilated renal pelvis. Comet-tail artifacts developed by reverberations within the strong reflector, the crystal (large arrows = artifacts)
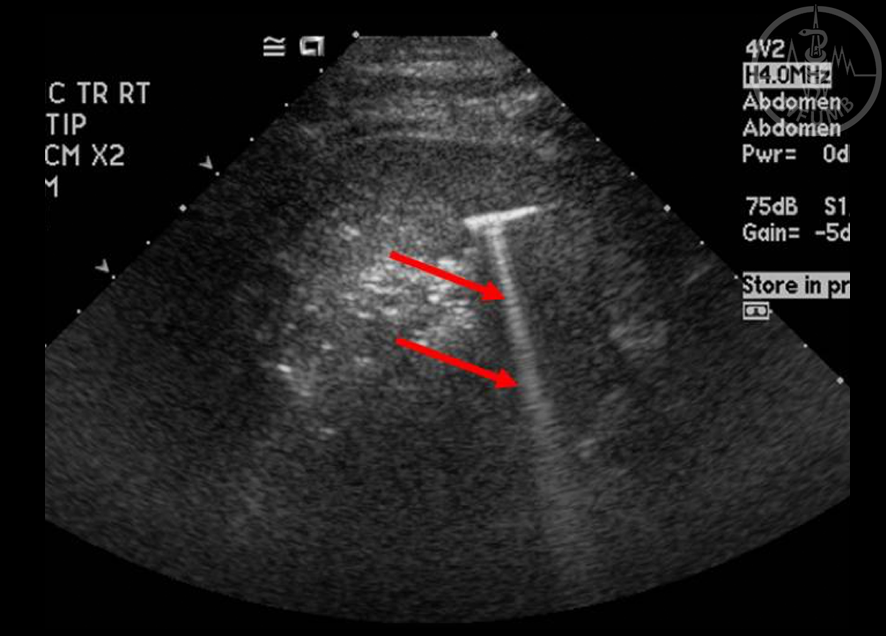
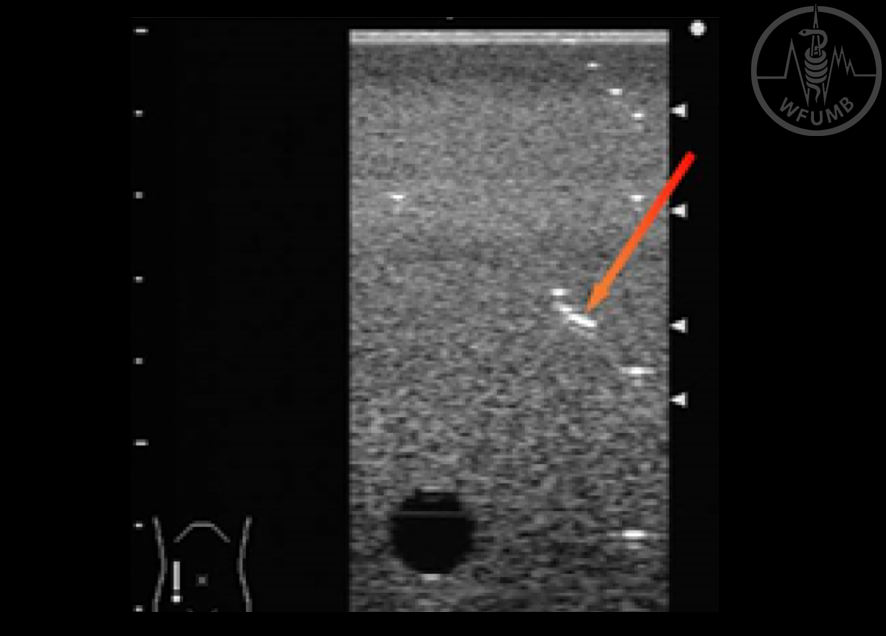
Fig 2.5b
Comet-tail artifact is a form of reverberation and resonance. Upper abdominal US, intercostal scans: During radiofrequecy ablation (RFA) of liver, reverberations in the needle electrode inserted into the liver casts comet-tail artifact (arrows)
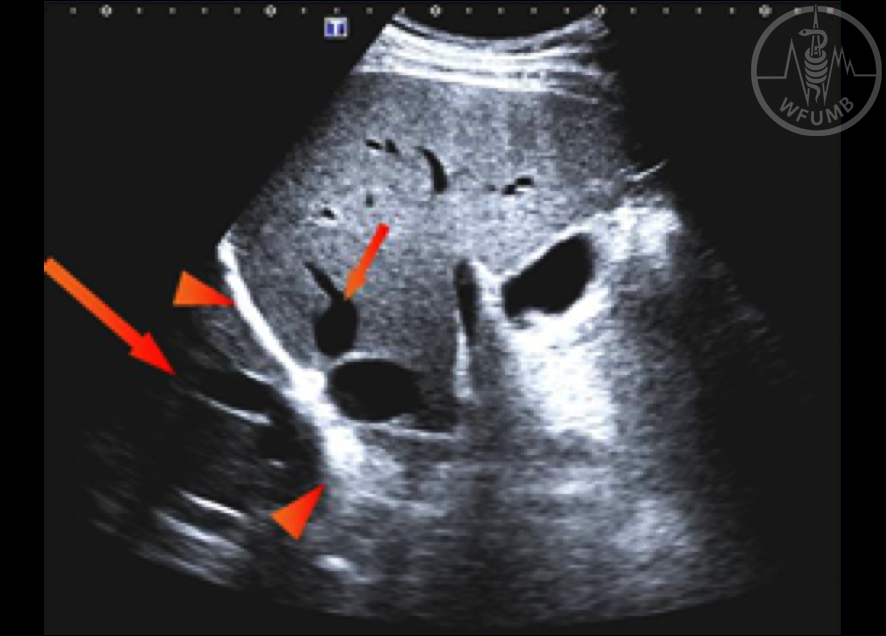
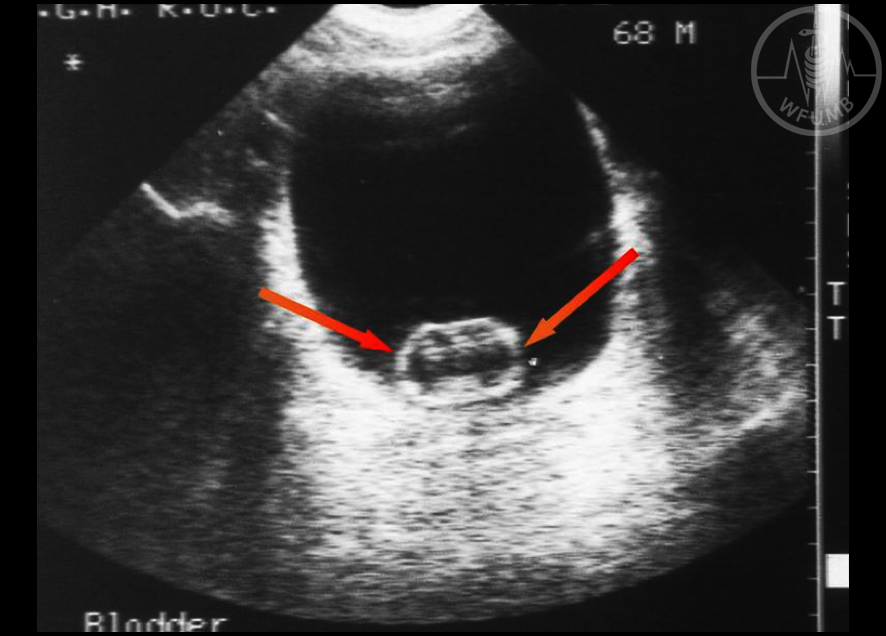
Fig 2.6a
Ring-down artifact is also a form of reverberation. It is typically developed from group(s) of small air bubbles in the stomach or small bowel lumens. Ring-down artifacts during transvaginal US caused by air bubbles in the small bowel (large arrows = artifacts)
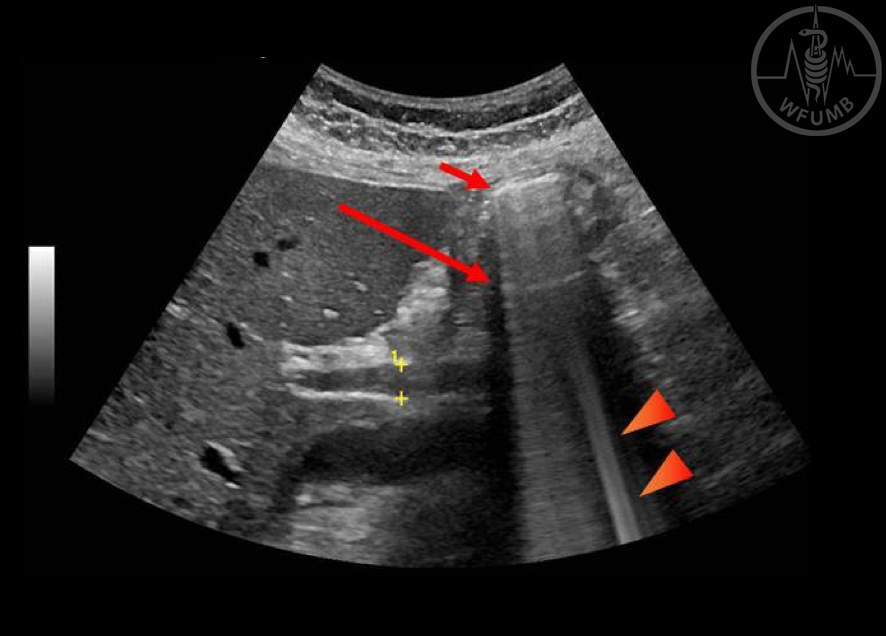
Fig 2.6b
Ring-down artifact is also a form of reverberation. It is typically developed from group(s) of small air bubbles in the stomach or small bowel lumens. Air in the stomach antrum (small arrow) causes reverberation artifacts (large arrows). A transient bright artifact (arrowheads) is the ring-down artifact caused by small air bubbles moving within the stomach
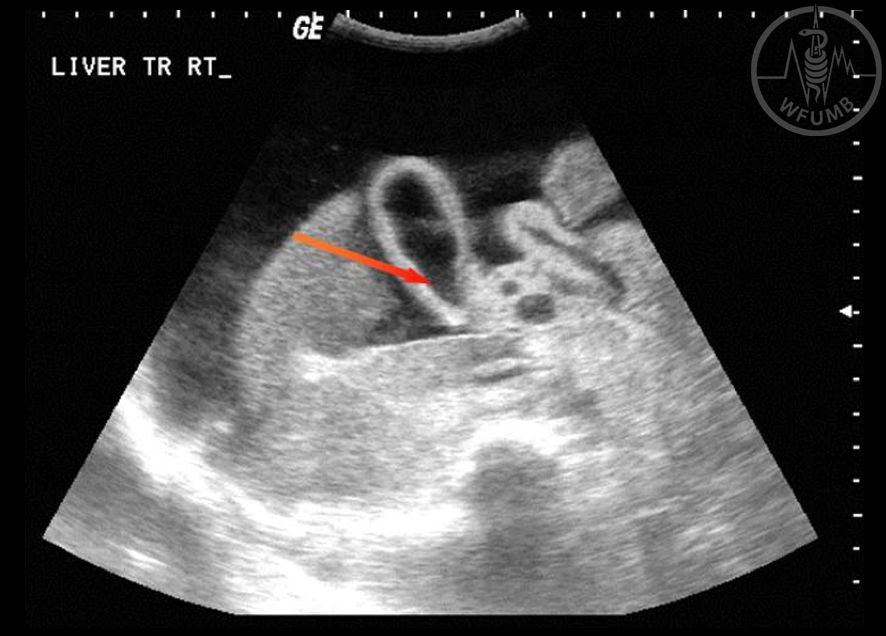
Fig 2.7a
Mirror image artifact is a form of multipath artifact. Transverse scan of the right hepatic lobe shows a hyperechoic hemangioma (small arrow). The mirror image (large arrow) is displayed on the other side of the visceral pleura (arrowheads) due to the strong echo at the interface
Fig 2.7b
Mirror image artifact is a form of multipath artifact. Intercostal scan of the right hepatic lobe shows 2 or 3 anechoic structures near the right hemidiaphragm (small arrow), consistent with the middle hepatic vein and inferior vena cava. The mirror image (large arrow) is displayed on the other side of the visceral pleura (arrowheads)
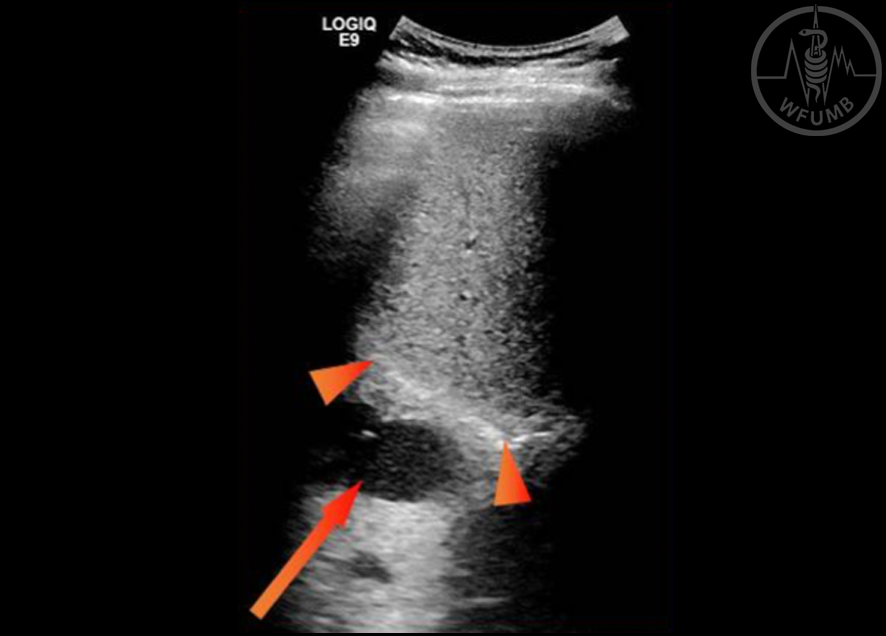
Fig 2.8a
Mirage artifact is similar to mirror image artifact. It appears when the reflected image is displayed but the real structure is not shown on the image. a) A nearly anechoic structure (arrow) located above the right hemidiaphragm (arrowheads) is noted
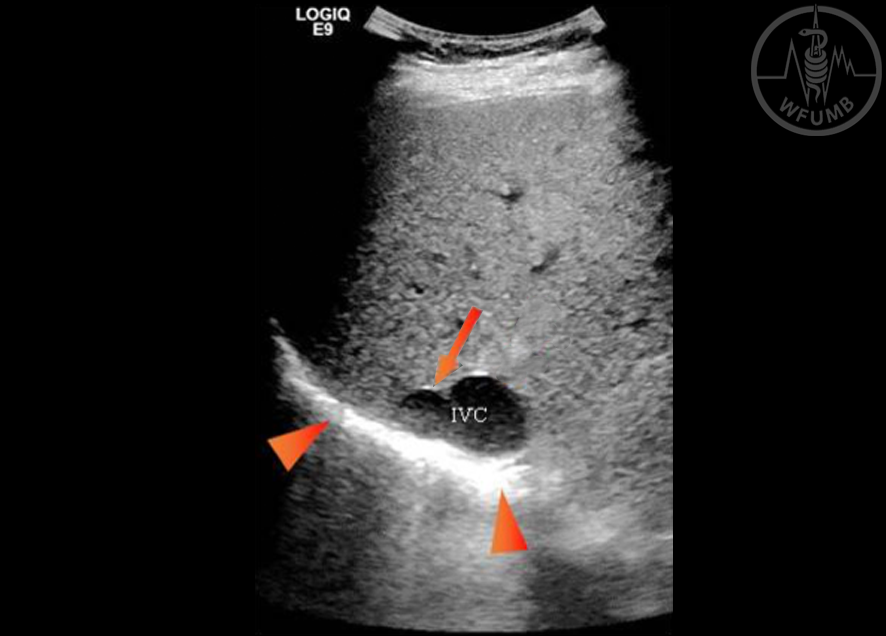
Fig 2.8b
Mirage artifact
Anatomically the anechoic inferior vena cava (IVC) and right hepatic vein (arrow) can be seen beneath the right hemidiaphragm (arrowheads)
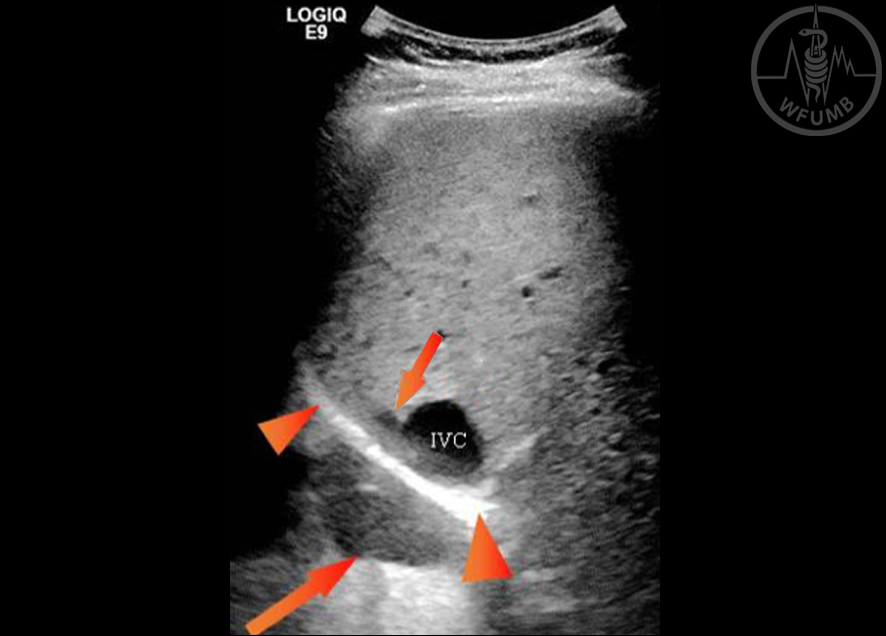
Fig 2.8c
Mirage artifact
The IVC and right hepatic vein (small arrow) are seen beneath the right hemidiaphragm (arrowheads). Mirror image artifact of IVC (large arrow) is seen above the diaphragm (arrowheads)
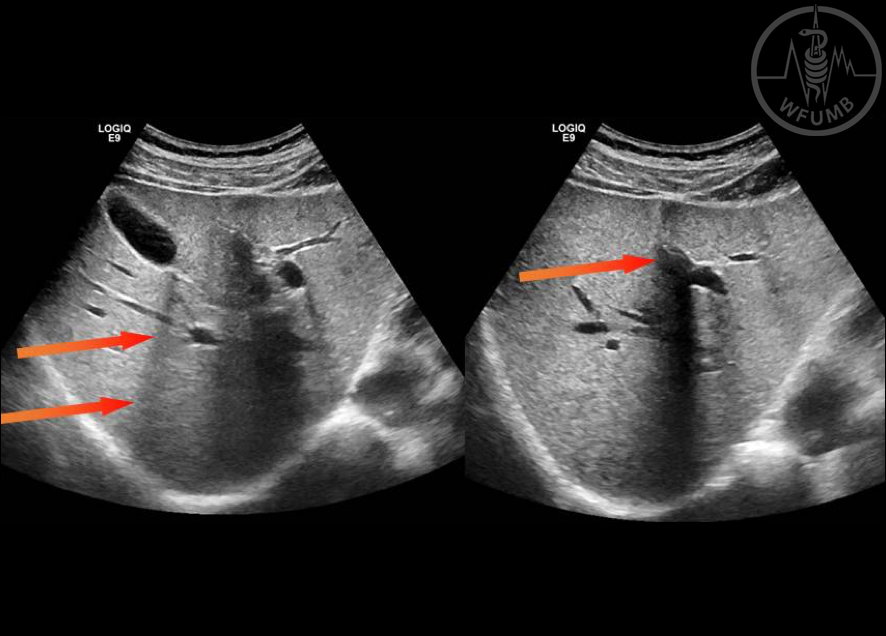
Fig 2.9a
Refraction artifacts.
Upper abdominal transverse US shows artifacts arising from the gallbladder margin (left figure, arrows) and from the falciform ligament (right figure, arrow)
Fig 2.9b
Refraction artifacts.
Double image artifacts (split image artifacts, ghost artifacts): Lower abdominal US, transverse scans of the urinary bladder. Refraction may cause single balloon of the Foley catheter to appear as a double balloon (arrows)
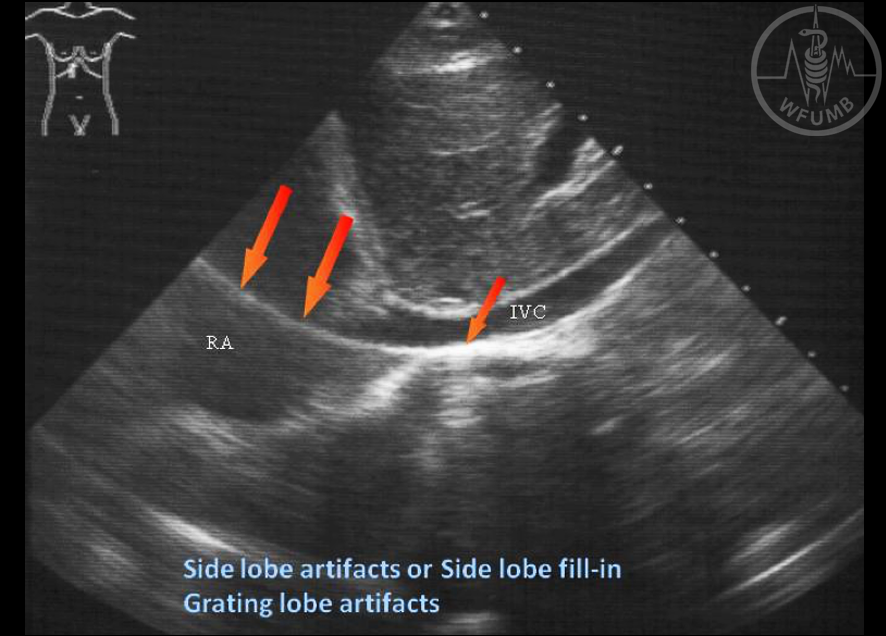
Fig 2.10 Side lobe artifacts (side lobe fill-in) and grating lobe artifacts: Side lobes are secondary (weaker) echoes outside the main beam. Note that echogenic curved line (large arrows) in the right atrium (RA) is tangential to the hyper reflective interface of inferior vena cava (IVC) and lung (or air, small arrow), and that happens when the main beams point towards the caudal direction
Fig 2.11 Slice thickness artifact is a type of image artifact normally appearing in anechoic areas (e.g., cyst, urinary bladder, gallbladder) and giving the appearance of “sludge” or “debris” (in this example, gallbladder neck, arrow). These artifactual echoes may be caused by the finite width of the transducer beam pattern which produces a finite thickness of the patient scan plane. All echoes produced in this “thick” scan plane are misinterpreted as being due to structures in the normally assumed “thin” scan plane
Fig 2.12a
Electrical noise or electromagnetic interference: Right upper abdominal transverse scan shows the liver B-mode images without electromagnetic
interference
Fig 2.12b
Electrical noise or electromagnetic interference: Right upper abdominal transverse scan shows the liver B-mode images without electromagnetic
interference
Fig 2.13a
Range-ambiguity artifacts (RAAs) are caused by mapping of returning echoes into an US image. RAAs take the form of a cloud-like, ill-demarcated echogenic area within the hepatic cyst
Fig 2.13b
RAAs can be reduced by changing the image depth or the scanning planes so that the bright, deep echoes are properly displayed
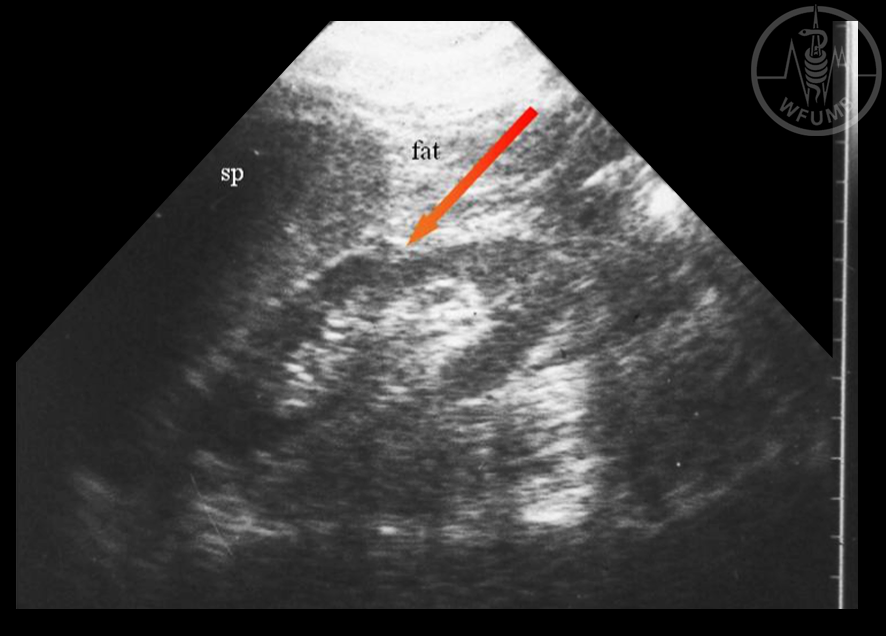
Fig 2.14
Distance measurement error (or speed displacement artifact). Coronal scan of the left flank region shows a crooked kidney which is partly caused by speed displacement artifact and partly by refraction artifact (arrow). In this example, the lower half of the left kidney is displaced distally because the propagation speed of sound in the retroperitoneum fat (fat) is lower than the spleen (sp)
Fig 2.15a
Acoustic shadow or acoustic shadowing on a US image is characterized by a signal void behind structures that strongly reflect or absorb US waves (energy). Acoustic shadows happen most frequently with hyper reflective solid structures, such as bone or stones - small layering gall stones (arrows)
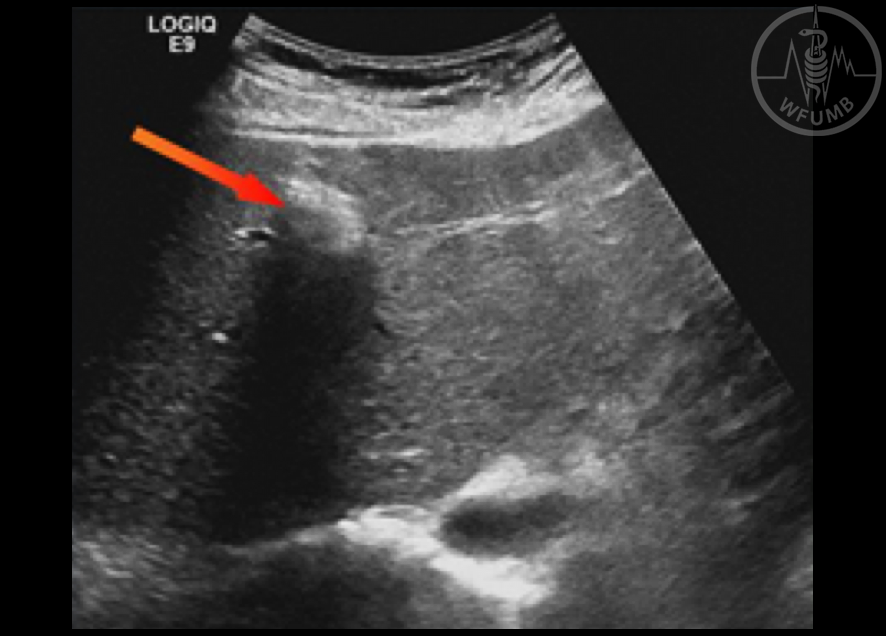
Fig 2.15b
Acoustic shadow or acoustic shadowing on a US image is characterized by a signal void behind structures that strongly reflect or absorb US waves (energy). Fat-containing structures may also reflect or absorb US waves strongly and result in acoustic shadowing (lipoma, arrow)
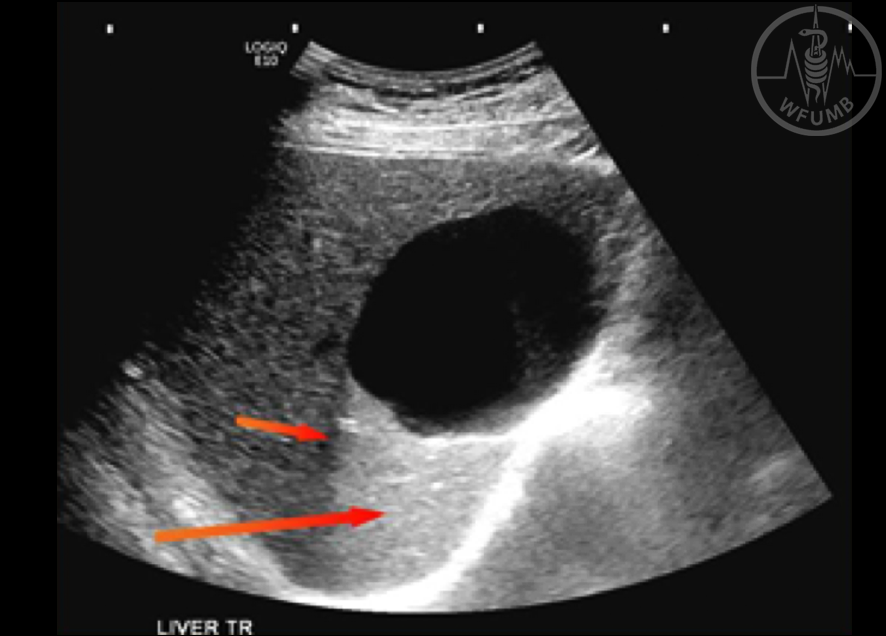
Fig 2.16a
Acoustic enhancement refers to the increased echoes distal/deep to structures that transmit sound exceptionally well. Right upper abdominal US shows a cyst in the liver. Acoustic enhancement distal to the cyst is evident (long arrow). Critical angle artifact occurs from the edge of the cyst (short arrow)
Fig 2.16b
Acoustic enhancement refers to the increased echoes distal/deep to structures that transmit sound exceptionally well. Right upper abdominal US shows a cyst in the liver. Acoustic enhancement distal to the gallbladder is evident (long arrow). Critical angle artifact occurs from the edge of the gallbladder (short arrow)
Fig 2.17a
Spatial resolution
Relatively good axial and lateral resolutions are demonstrated to separate hyper-reflective objects (arrow)
Fig 2.17b
Spatial resolution
Both axial position blurring and lateral position blurring are noted (arrow). In addition one can note axial and lateral field lobes associated with many of the wire targets
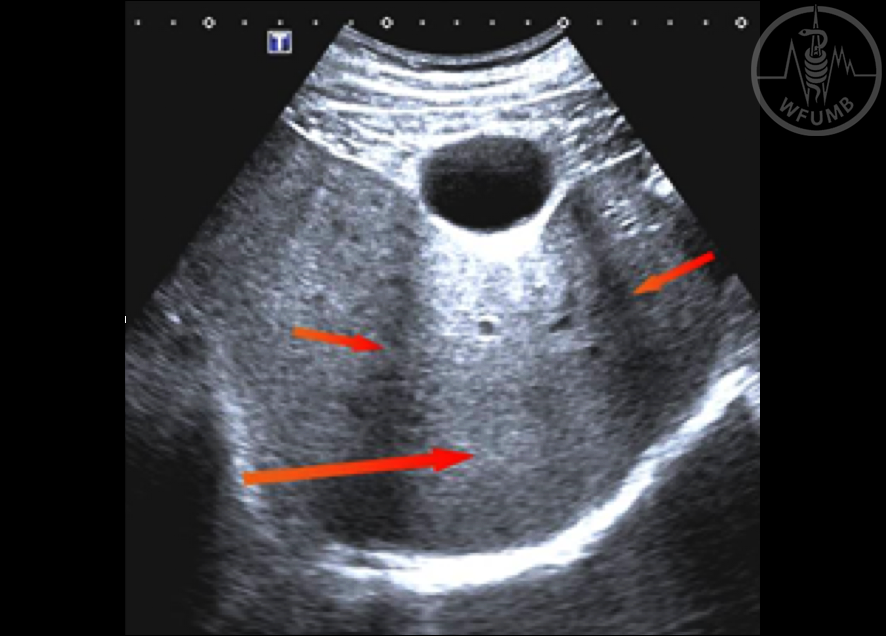
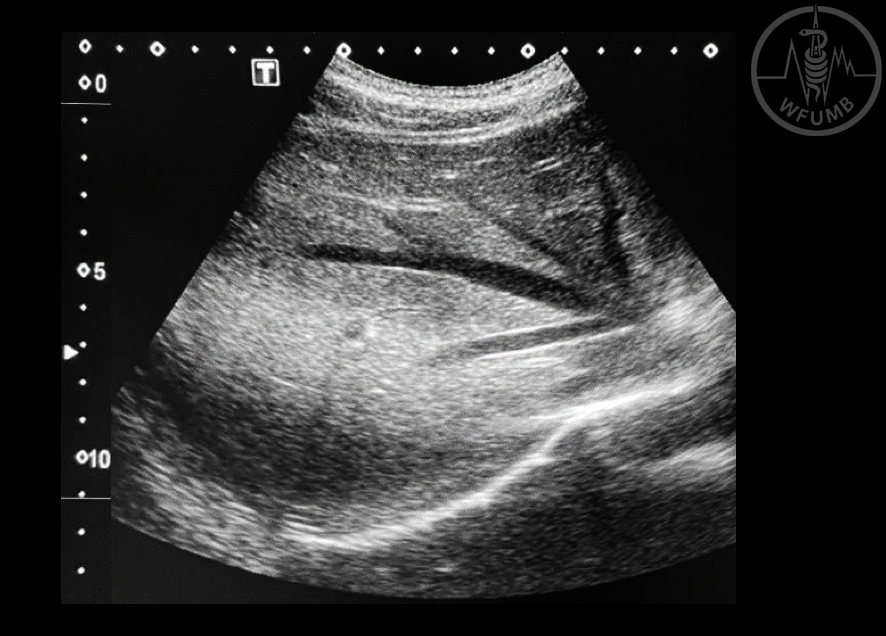
Fig 2.18
Focal zone enhancement: Increased intensity in the focal region can cause brighter echoes. This phenomenon can create a band of increased echogenicity in an organ that normally should be homogeneous. This is called focal zone enhancement or focal zone banding.
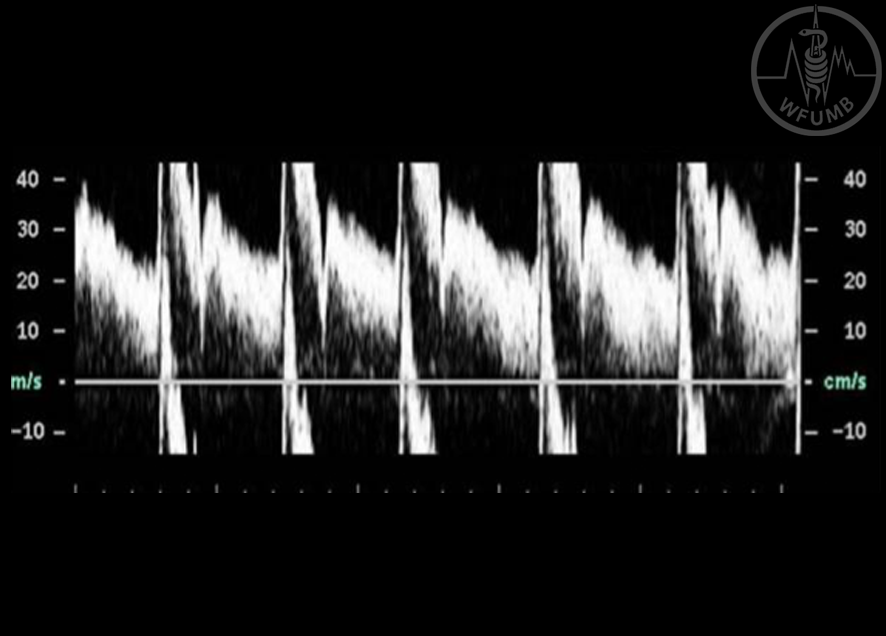
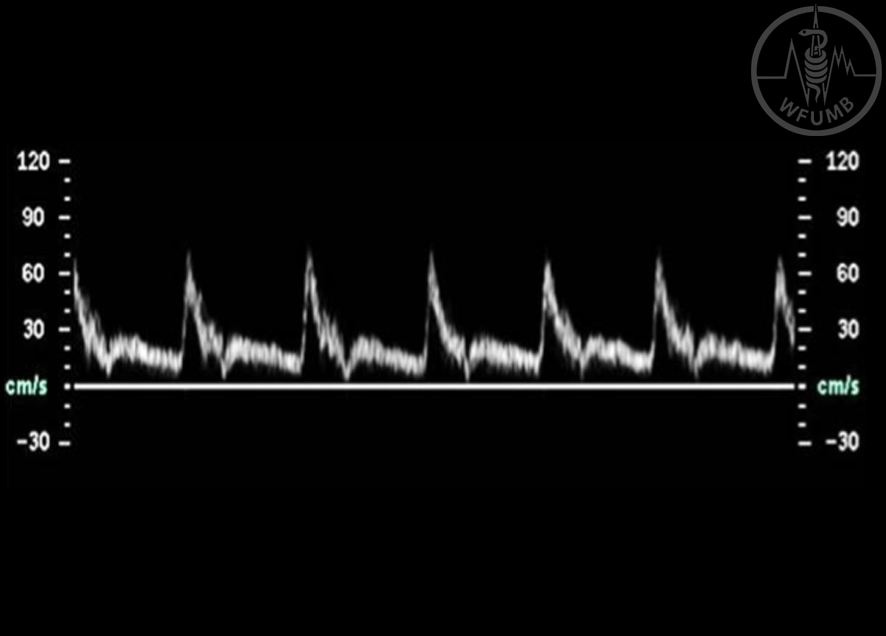
Fig 2.19a
Aliasing is a phenomenon inherent to pulsed wave Doppler US modalities. In case of spectral Doppler the velocity peak is cut off at the top of the positive velocity scale, and the peak wraps around to the bottom of the scale, often overlapping with the rest of the curve
Fig 2.19b
Aliasing
The artifact can be quickly remedied by lowering the baseline, or increasing the pulse repetition frequency (PRF)
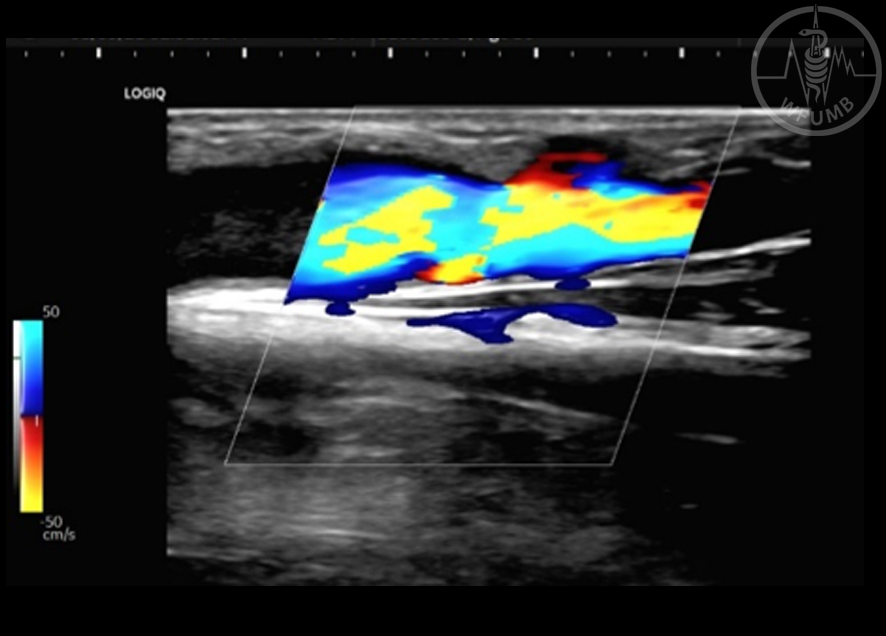
Fig 2.19c
Aliasing
In color Doppler aliasing is encountered as red to blue hues immediately adjacent to each other in a vessel
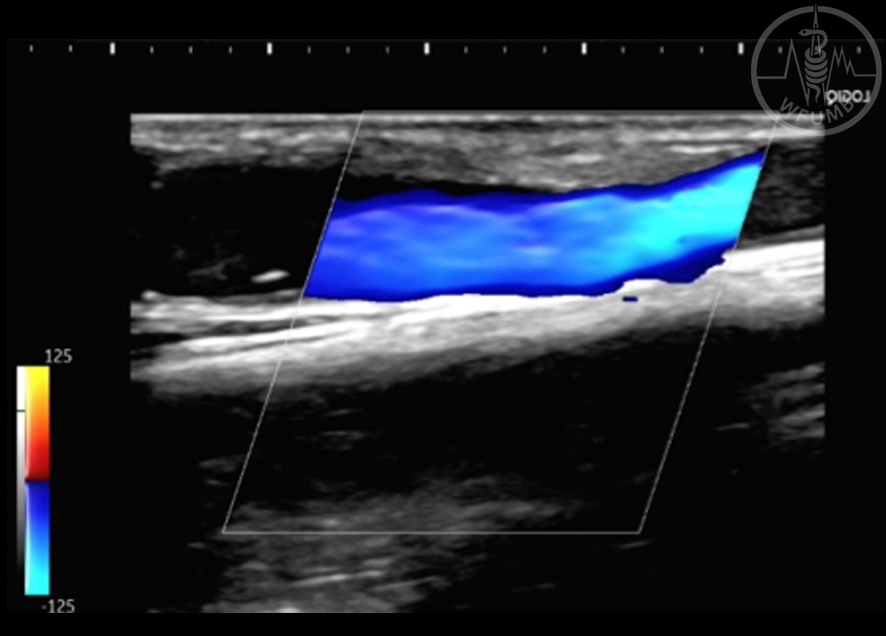
Fig 2.19d
Aliasing
The artifact immediately disappears if the upper limit of the velocity scale is increased above the peak flow velocity
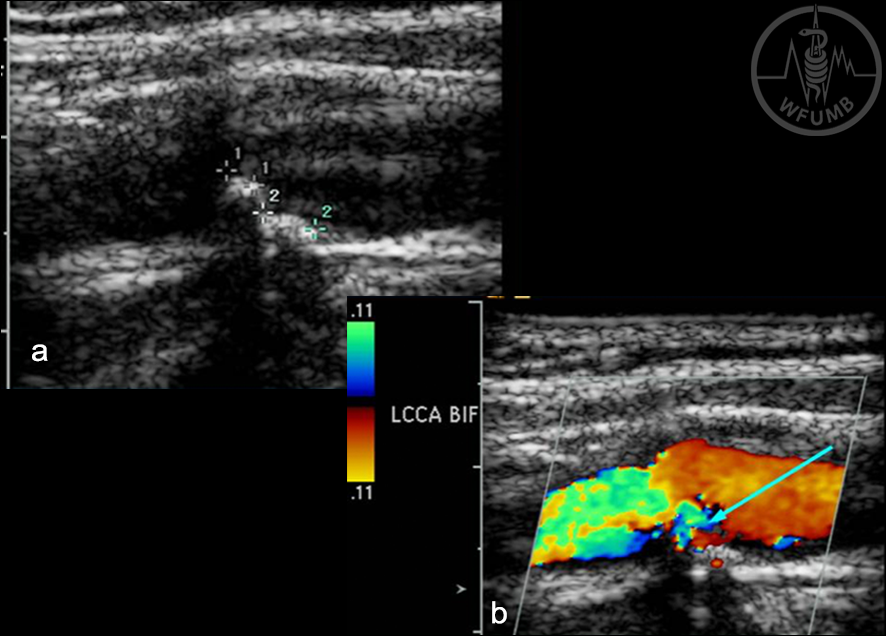
Fig 2.20a
The twinkle artifact,
which is a random strong reflection of the incident US beam at a rough surface formed by stone or other calcified materials or cholesterol deposits. When scanning the carotid artery, hard plaque such as cholesterol deposits (a, labeled strongly reflective structures), may produce twinkle artifact which may be mistaken for blood flow signals within the plaque
(b, arrow)