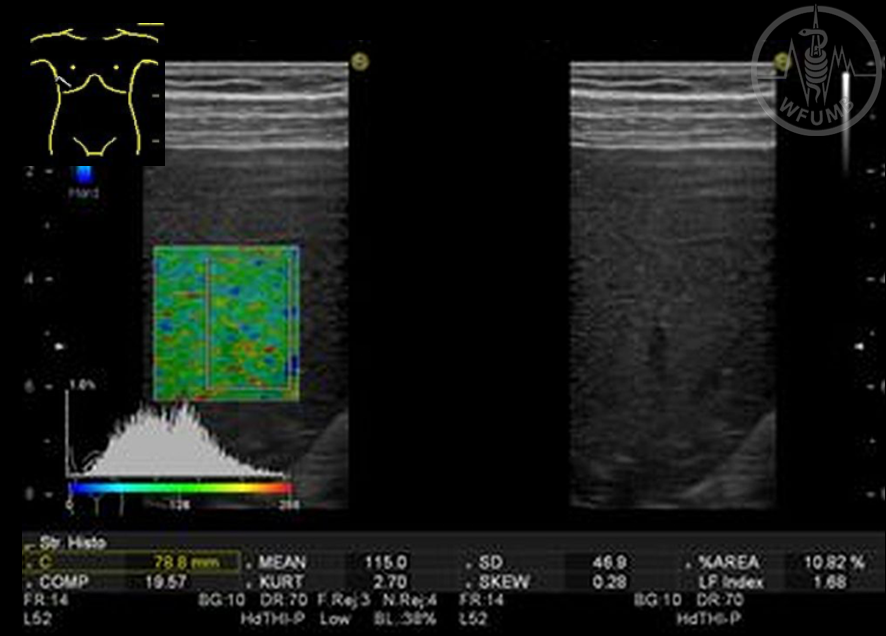
Fig 33.1a
SE of the liver – Hitachi Aloka system. From F1 to F4 fibrosis stage, color variation of the SE increases - low strain regions (LFI=1.68) in a patient with F1
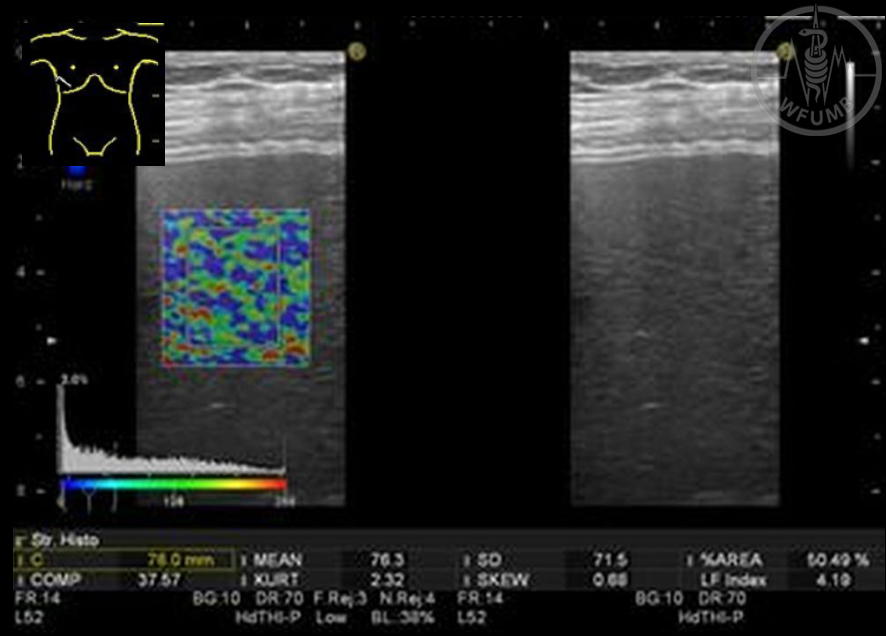
Fig 33.1b
SE of the liver – Hitachi Aloka system. From F1 to F4 fibrosis stage, color variation of the SE increases - a patched image pattern (LFI=4.19) in a patient with F4
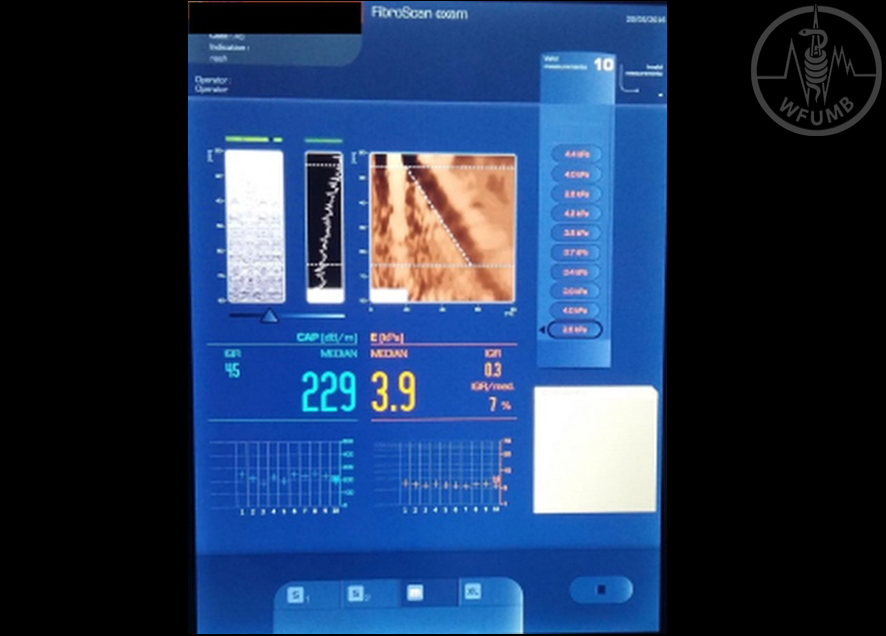
Fig 33.2
TE measurement by FibroScan in a normal liver. LS values in orange (median of 10 measurements = 3.9 kPa and IQR/M =7%). In blue estimation of steatosis by controlled attenuation parameter (CAP)
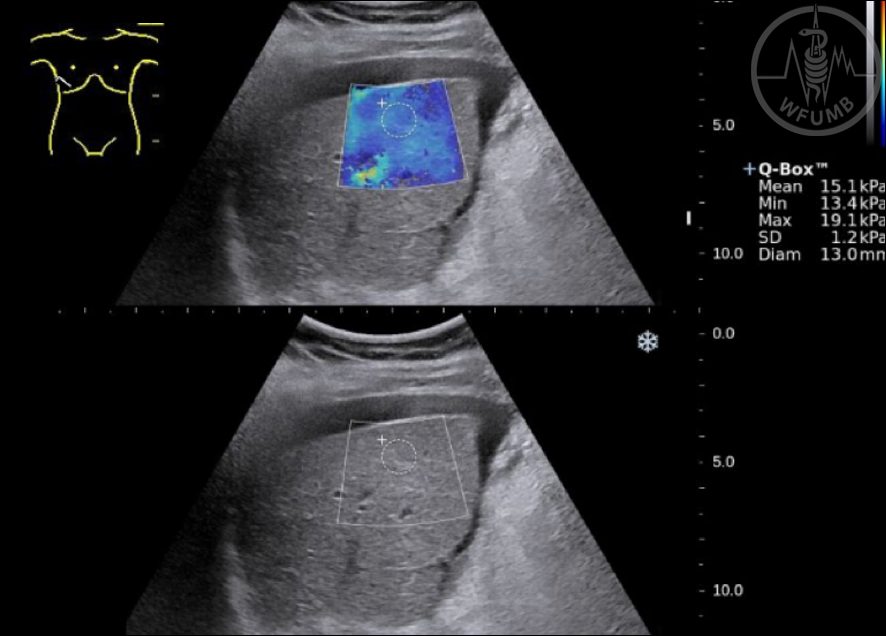
Fig 33.3
2D-SWE measurement by the Aixplorer (Supersonic Imagine) system in a patient with ascites. Mean LS value inside the ROI is 15.1 kPa. Measurement made in the most homogeneous area of the elastogram
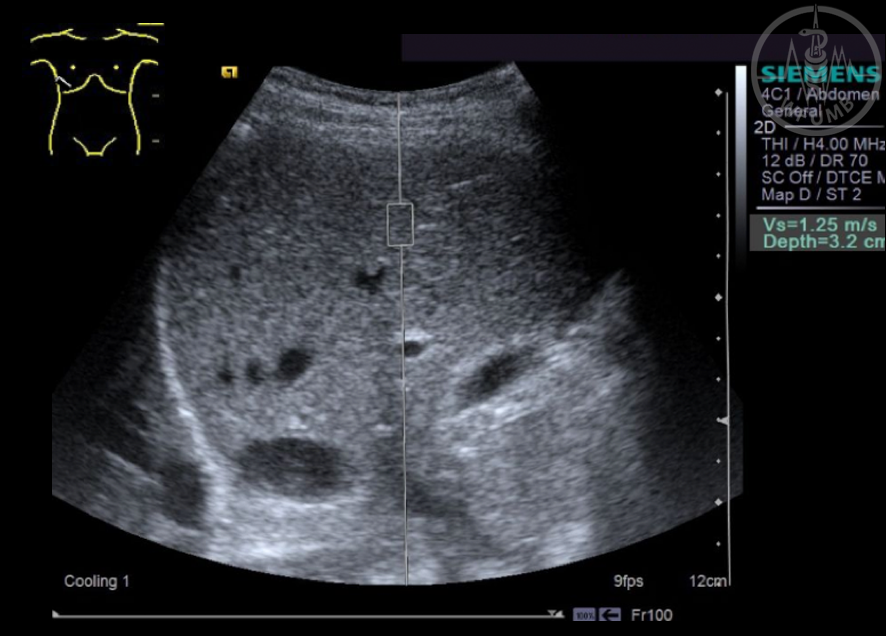
Fig 33.4
pSWE measurement of LS
by Virtual Touch Quantification (VTQ) technique from Siemens.
Measurement value 1.25 m/s
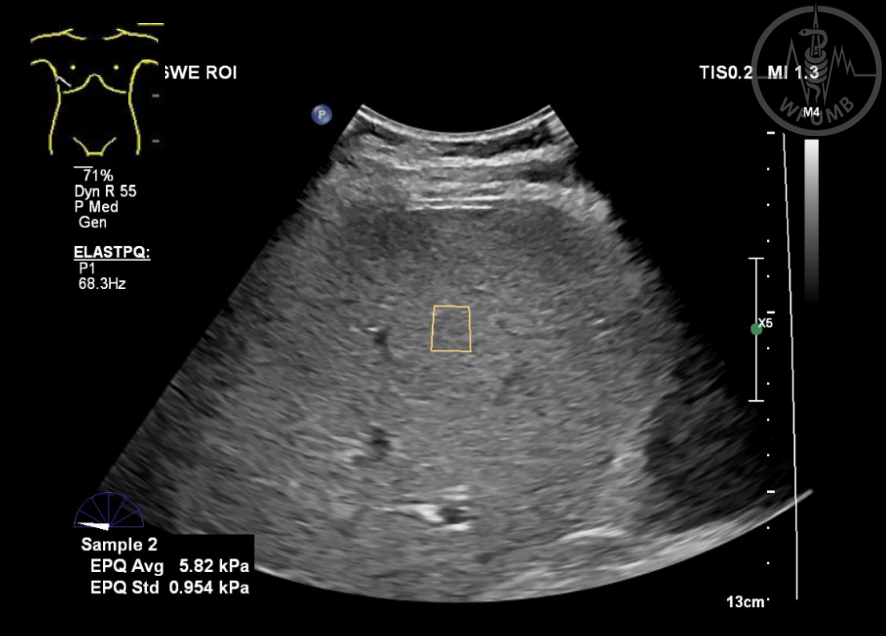
Fig 33.5
pSWE measurement of LS by ElastPQ technique from Philips. Measurement value 5.82 kPa
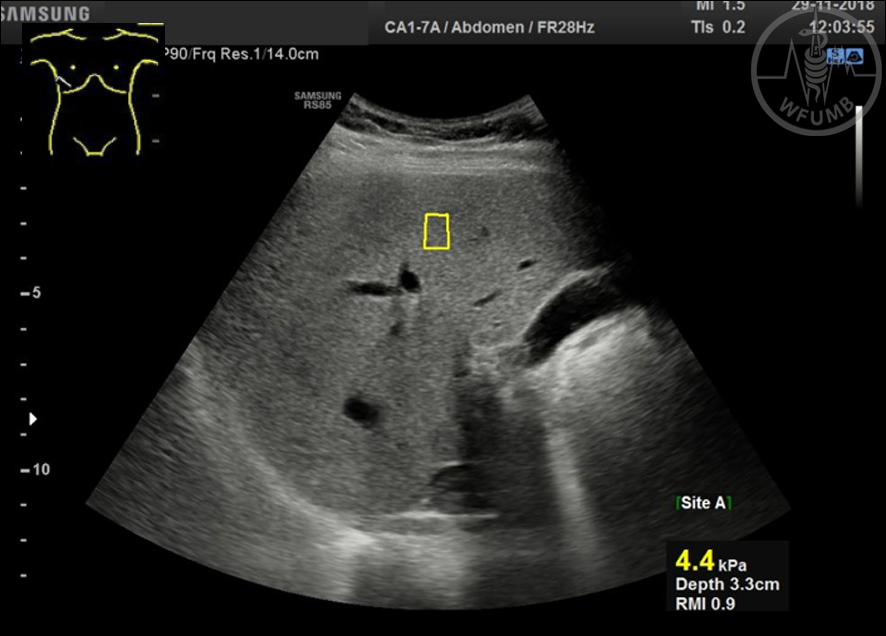
Fig 33.6
LS measurement by S-Shearwave Imaging technique from Samsung-Medison. Measurement value is 4.4 kPa
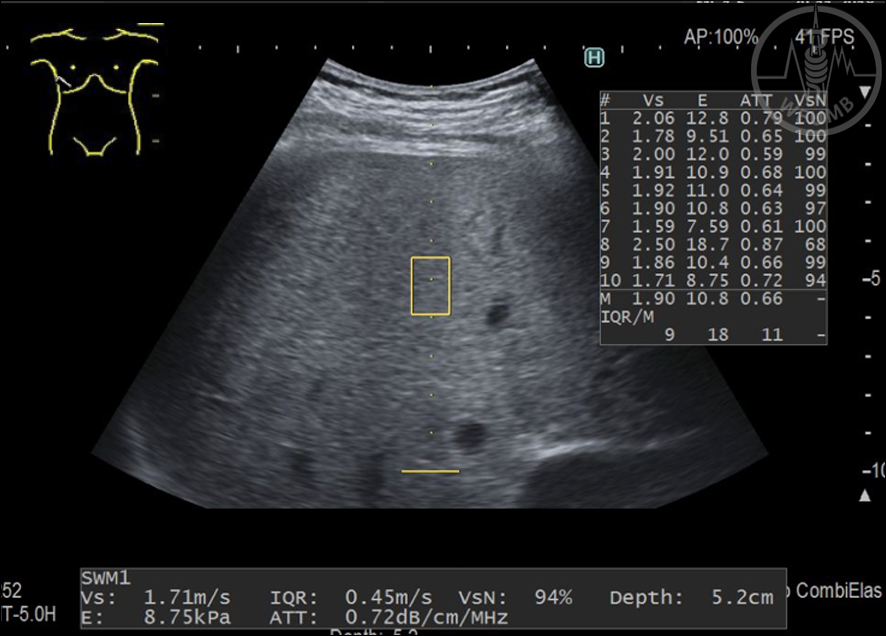
Fig 33.7
LS measurement by pSWE technique from Hitachi. Ten measurements made, their median value is 1.71 m/s (8.75 kPa)
Fig 33.8
2D-SWE measurement by the Aixplorer (Supersonic Imagine) system in a patient with cirrhosis. Mean LS value inside the ROI is 13.8 kPa. Measurement made in the most homogeneous area of the elastogram
Fig 33.9
LS measurement by 2D-SWE from General Electric in a patient with cirrhosis. Mean LS value inside the ROI is 13.8 kPa. Measurement made in the most homogeneous area of the elastogram
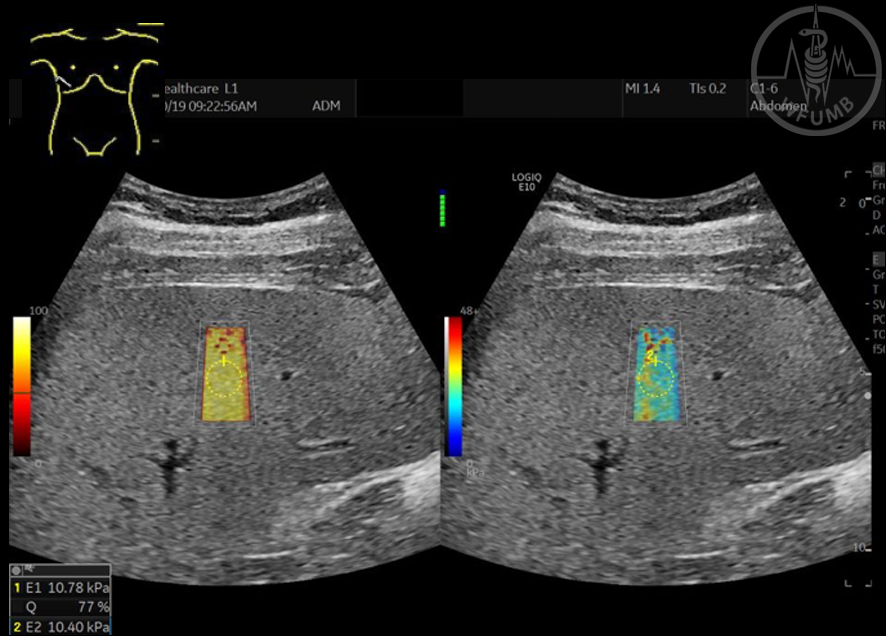
Fig 33.10
LS measurement by 2D-SWE from General Electric in a patient with cirrhosis. Left side of the image – confidence map. Right side of the image – elasticity map. Measurement made in the most homogeneous area
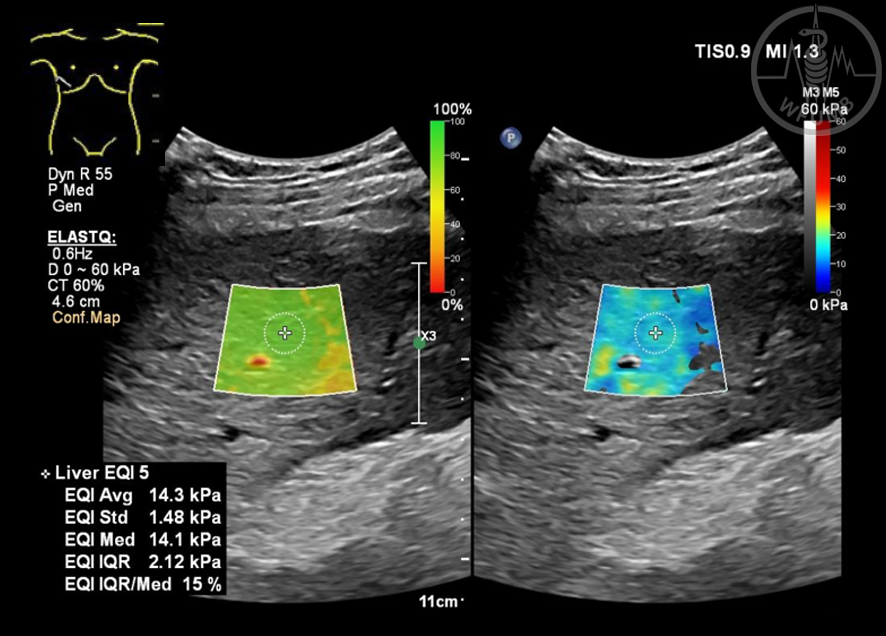
Fig 33.11
2D-SWE measurement of LS by ElastQ technique from Philips. Measurements made in the most homogeneous areas. Left side of the image: confidence map.
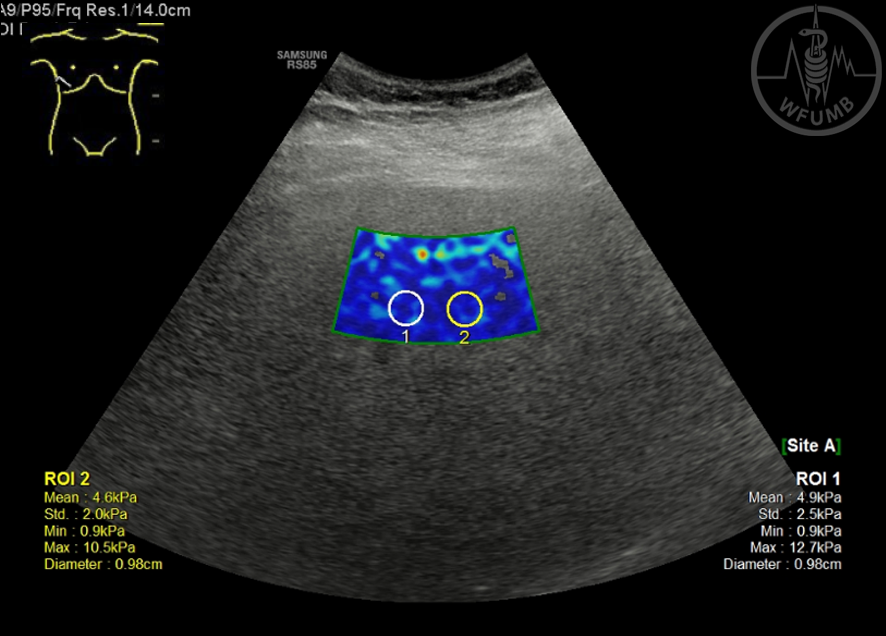
Fig 33.12
2D-SWE measurement of LS by S-Shearwave Imaging technique from Samsung-Medison.
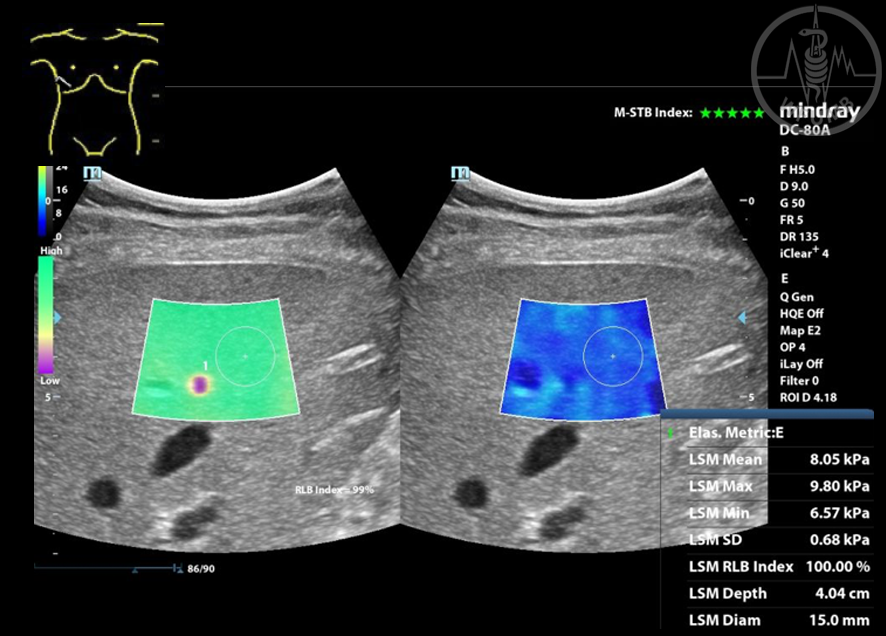
Fig 33.13
LS measurement by 2D-SWE from Mindray. Left side of the image – reliability map. Right side of the image – elasticity map. Measurement made in the most homogeneous area, mean value in the ROI 8.05 kPa
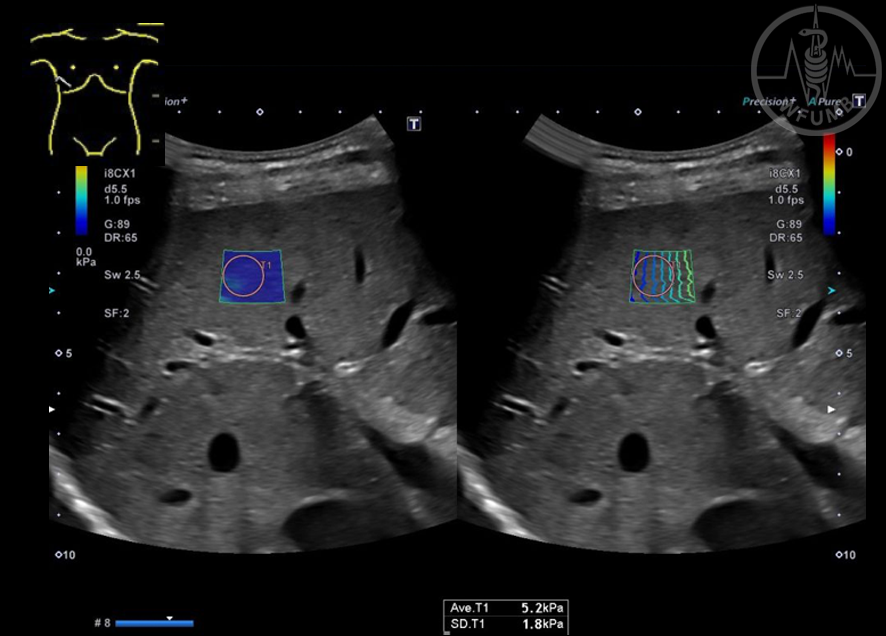
Fig 33.14
LS measurement by 2D-SWE from Canon. Left side of the image – elastogram. Right side of the image – propagation map. Measurement made in the area with parallel lines, mean value in the ROI 5.2 kPa
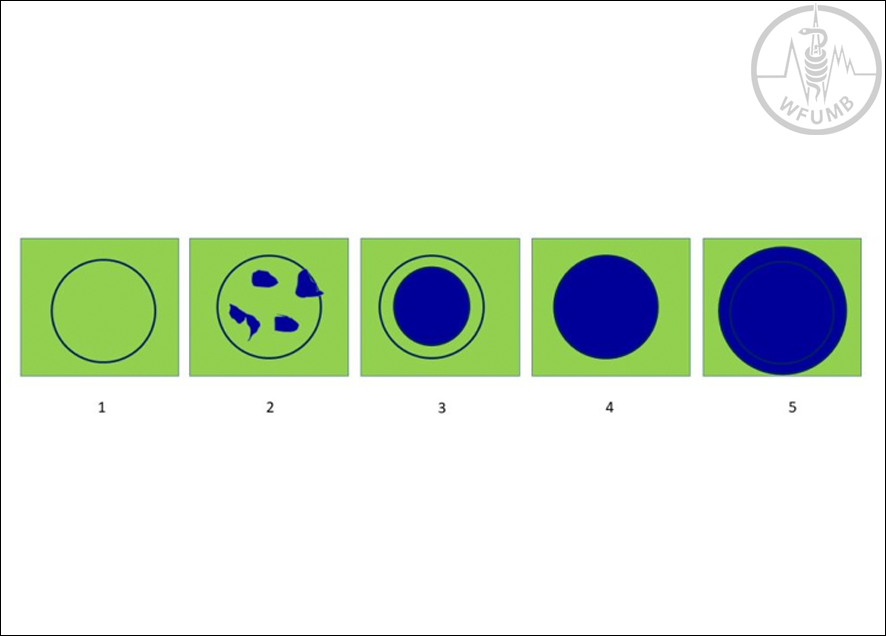
Fig 33.15
Tsukuba score. 1- soft lesion (green); 2 - mixed pattern; 3 - hard lesion (blue), but smaller on the elastogram than on B-mode US; 4 - hard lesion and the same size on elastography as in B-mode; 5 – lard lesion and larger on elastography
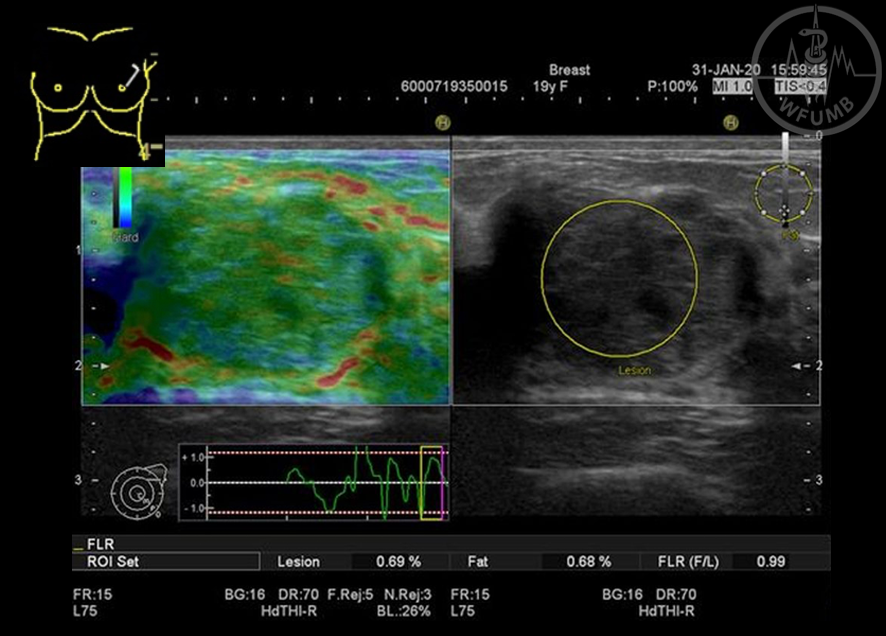
Fig 33.16
BIRADS 3 (low risk) nodule in gray scale US: solid pattern, hypoechoic, regular margins, posterior enhancement, oval shape. SE (Hitachi) color code map 1 – low stiffness. Strain ratio = 0.99 – Fibroadenoma
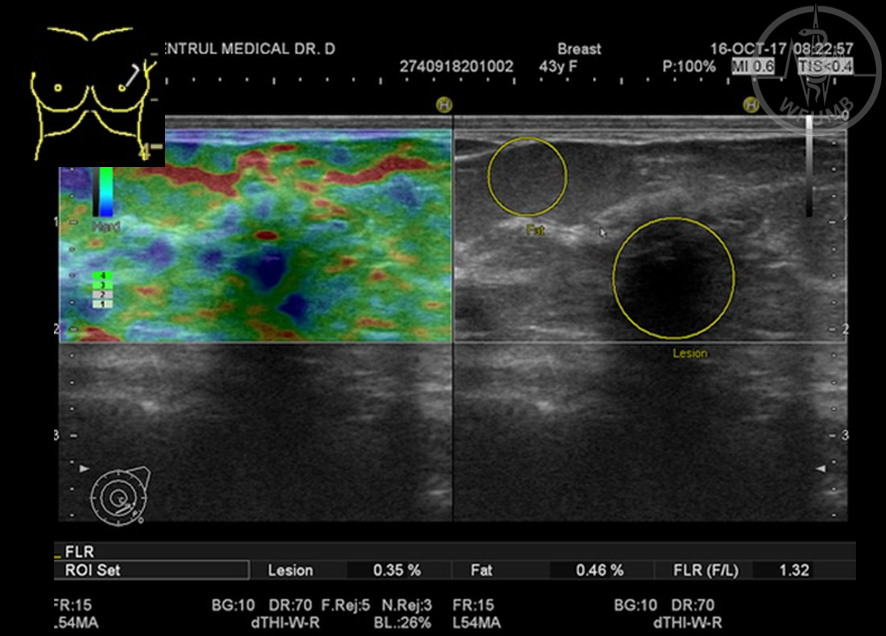
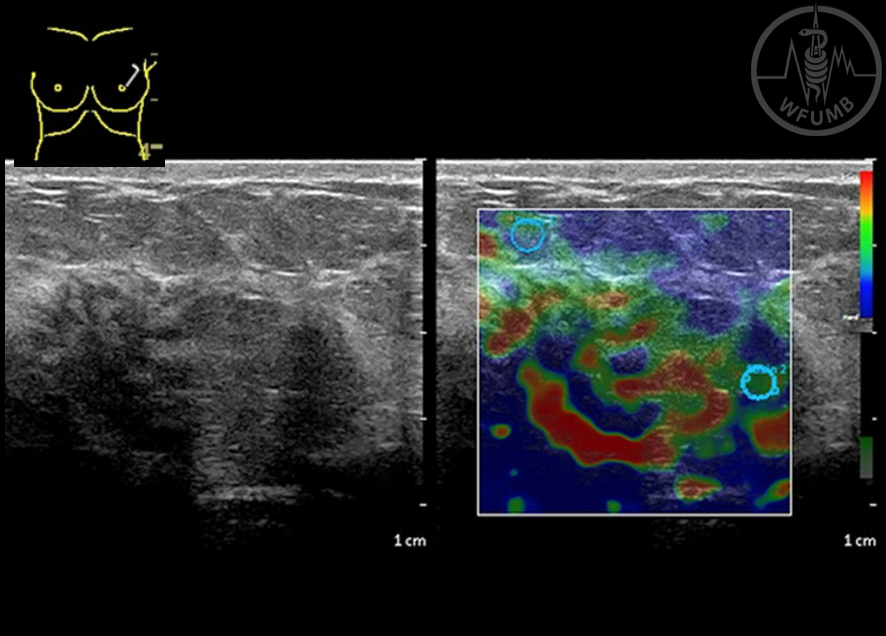
Fig 33.17
BIRADS 4a (Intermediate risk) nodule in gray scale US: solid pattern, intense hypoechoic, spiculated margins, oval shape. SE (Hitachi) color code map 2 – isolated point of increased stiffness. Strain ratio = 1.32 Lobar hyperplasia
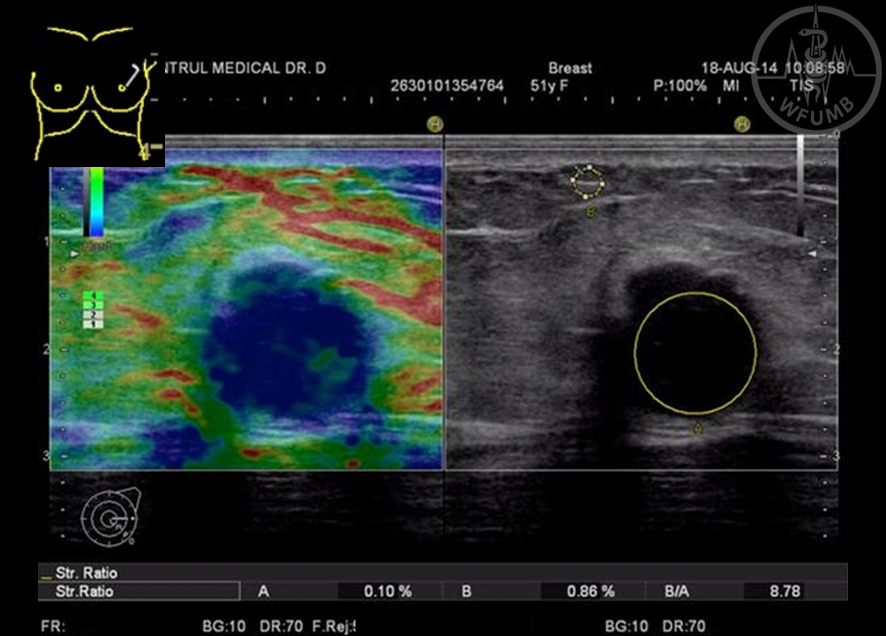
Fig 33.18
BIRADS 5 (high risk) nodule in gray scale US: solid pattern, intense hypoechoic, irregular margins, posterior shadowing, infiltration, taller than wide shape. SE (Hitachi) color code map 4 – increased stiffness area that equals the gray scale image. Strain ratio = 8.78 - Breast cancer
Fig 33.19
BIRADS 3 (low risk) nodule in gray scale US: solid pattern, mild hypoechoic, oval shape, clear margins, no posterior phenomenon, oval shape, partially inhomogeneous. SE (Philips) color code map 32 – predominant low strain
Fig 33.20
BIRADS 4A (intermediate risk) nodule in gray scale US: solid pattern, intense hypoechoic, oval shape, clear margins, no posterior phenomenon, inhomogeneity. SE (Philips) color code map 3 – predominant stiff image = risk upgrade (4B)
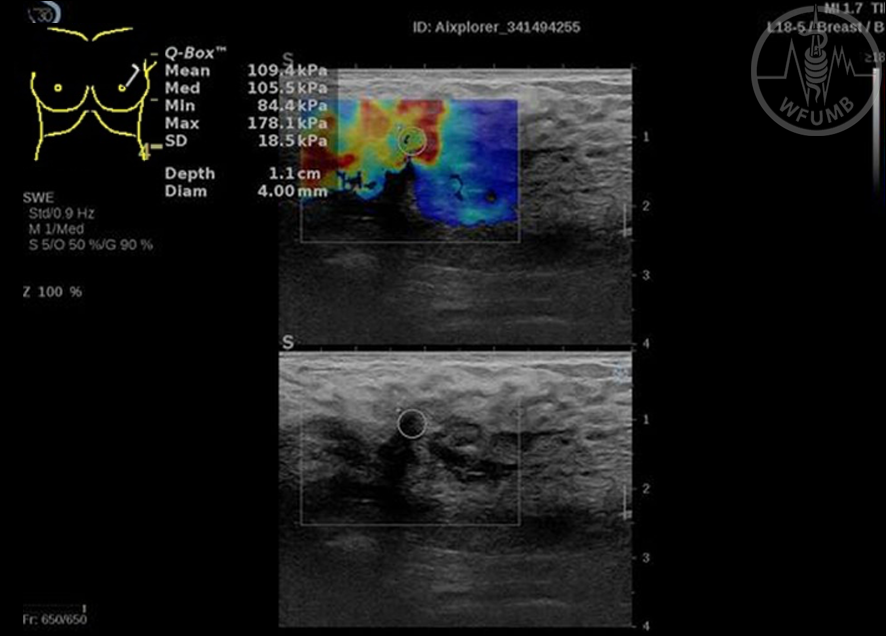
Fig 33.22
BIRADS 5 (high risk) nodule in gray scale US: solid pattern, irregular shape, intense hypoechoic, posterior shadowing, unclear margins. 2D-SWE (Mac 30 Aixplorer) color code map 4 – complete stiff area. Mean elasticity = 109.4 kPa - Breast cancer
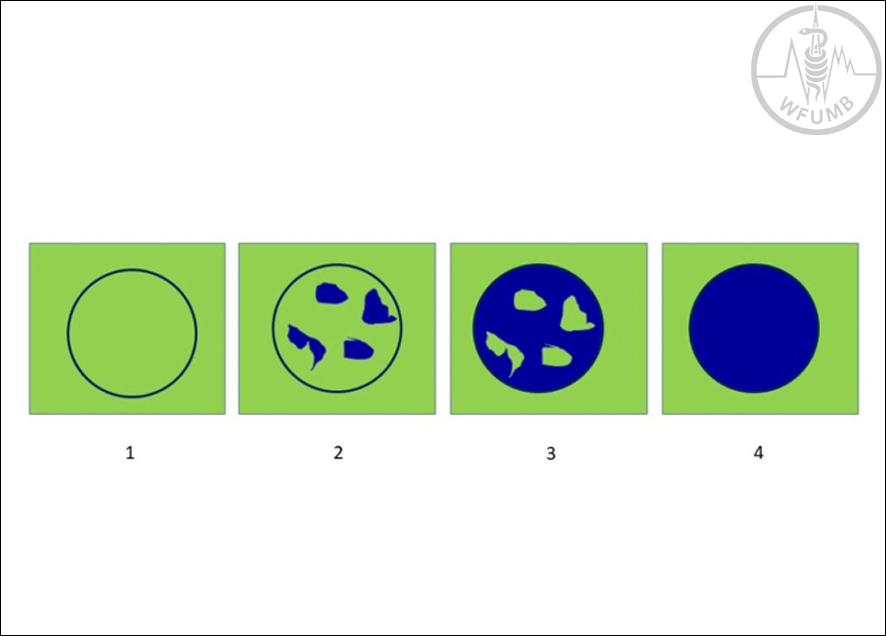
Fig 33.23
Four-pattern scoring system for SE of thyroid nodules: 1 - entirely green nodule (soft); 2 - mostly green nodule, with some blue areas; 3 – mostly blue nodule, with some green areas; 4 - entirely blue nodule (hard)
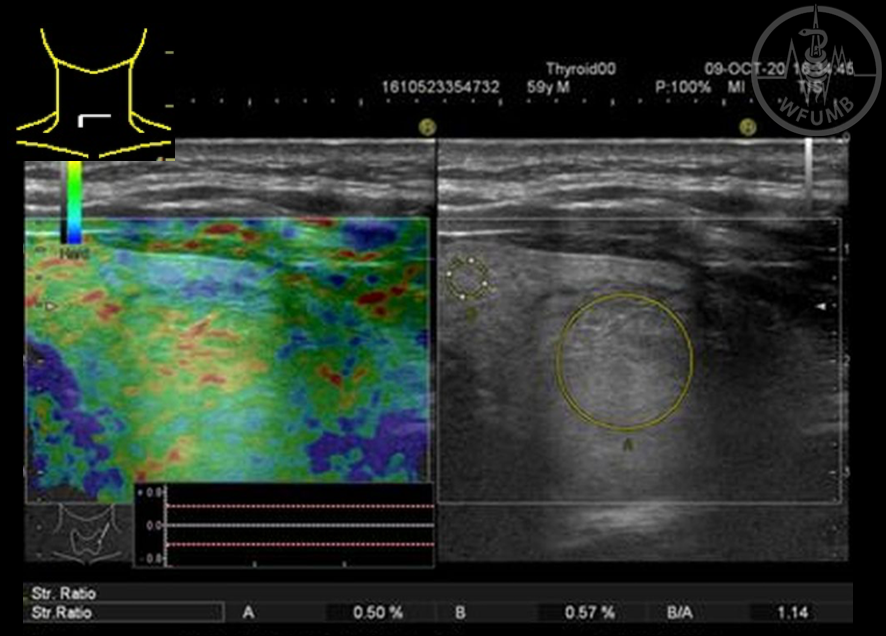
Fig 33.24
Low risk thyroid nodule in gray scale US: solid pattern, oval shape, isoechoic, clear margins, regular shape, no posterior phenomenon. SE (Hitachi Preirus) color code 1 – low. Strain ratio = 1.14
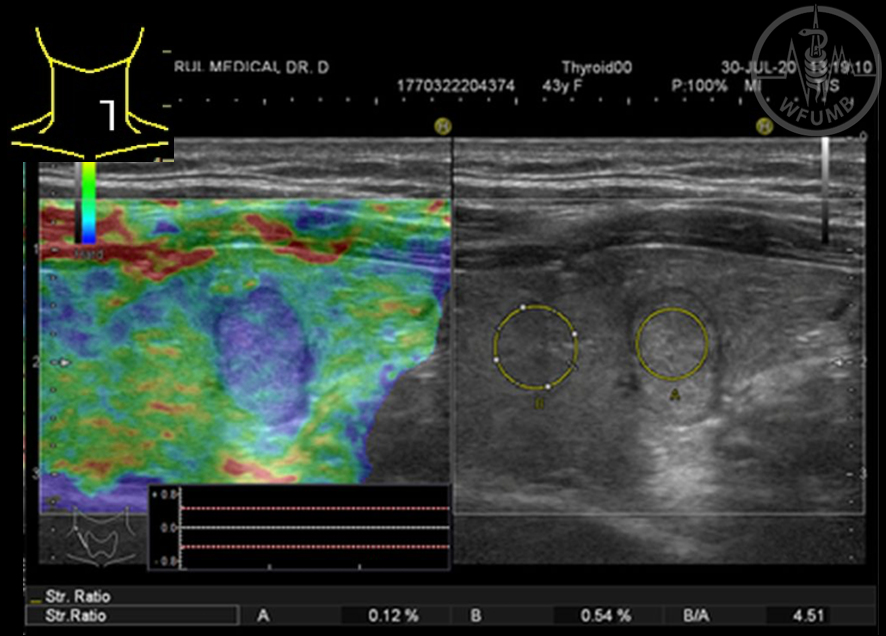
Fig 33.25
Intermediate risk thyroid nodule in gray scale US: solid pattern, taller than wide shape clear margins, no calcification, no posterior phenomenon. SE (Hitachi Preirus) color code 3 – increased stiffness - risk upgrade. Strain ratio = 4.5
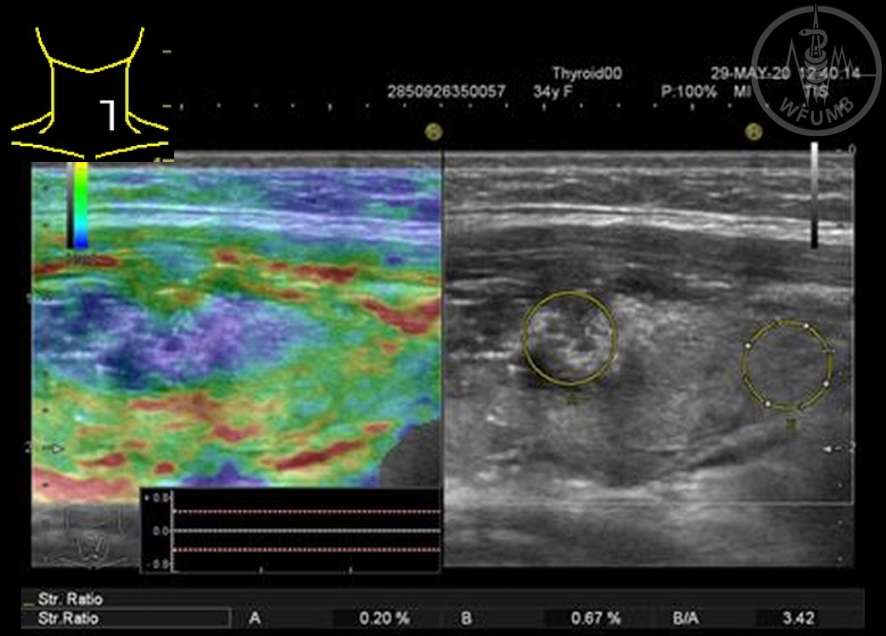
Fig 33.26
High risk thyroid nodule in gray scale US: solid pattern, irregular margins, inhomogeneous, posterior partial attenuation. SE (Hitachi Preirus) color code 4 – increased stiffness - ads risk to the nodule’ evaluation. Strain ratio = 3.42
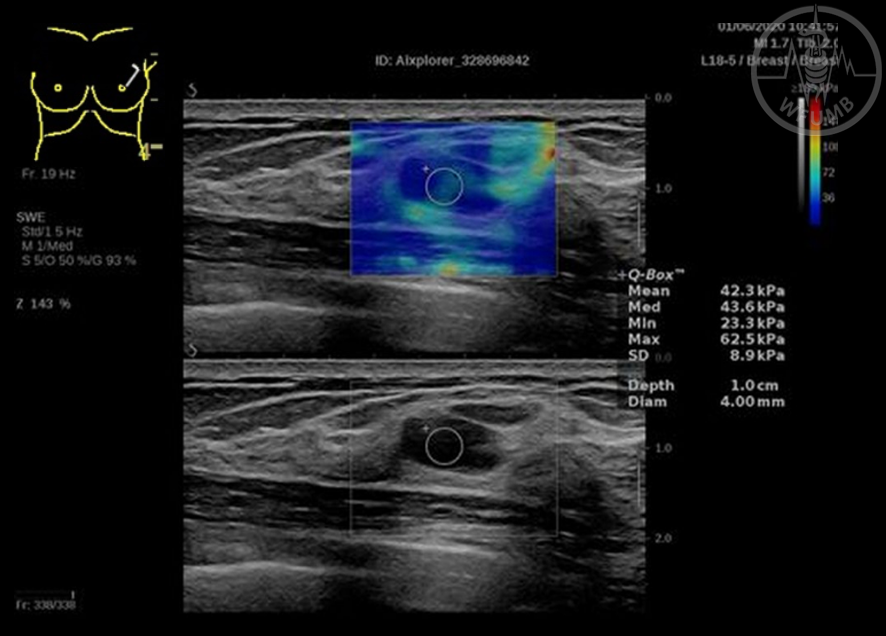
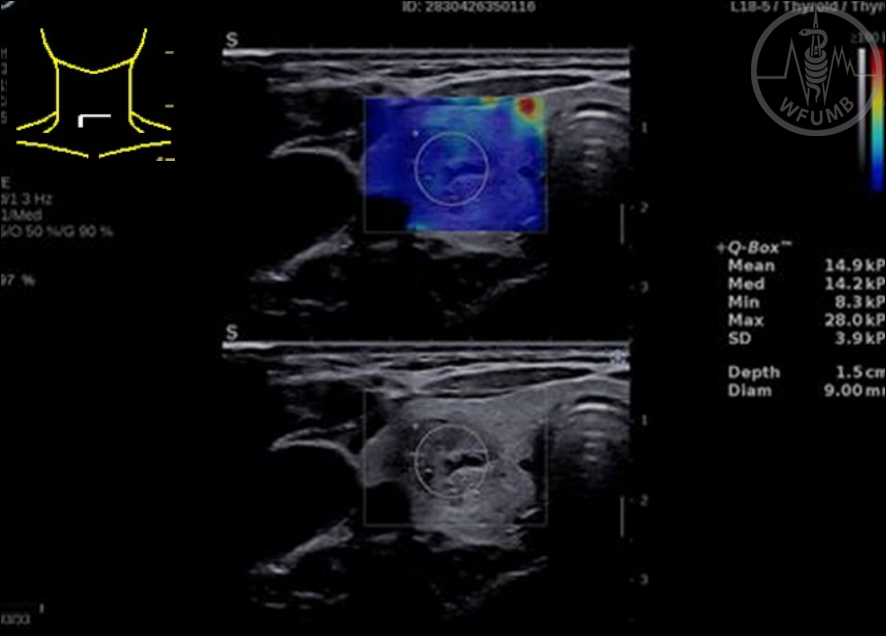
Fig 33.27
Low risk thyroid nodule in gray scale US: solid pattern, oval shape, isoechoic, clear margins, regular shape, no posterior phenomenon, cystic degeneration. 2D-SWE (Mac 30 Aixplorer) color code 1 – low stiffness - reconfirmation of low risk category. Mean elasticity = 14.9 kPa
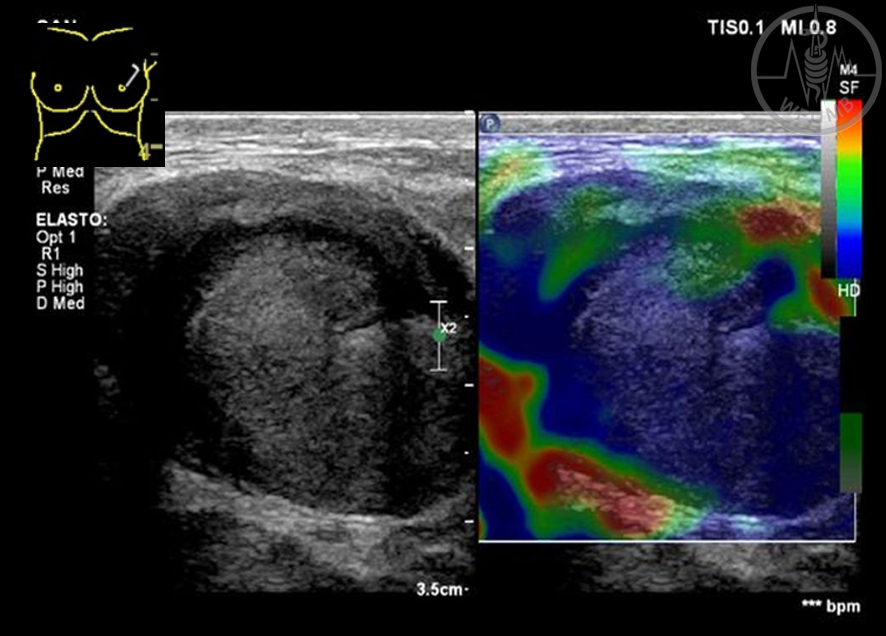
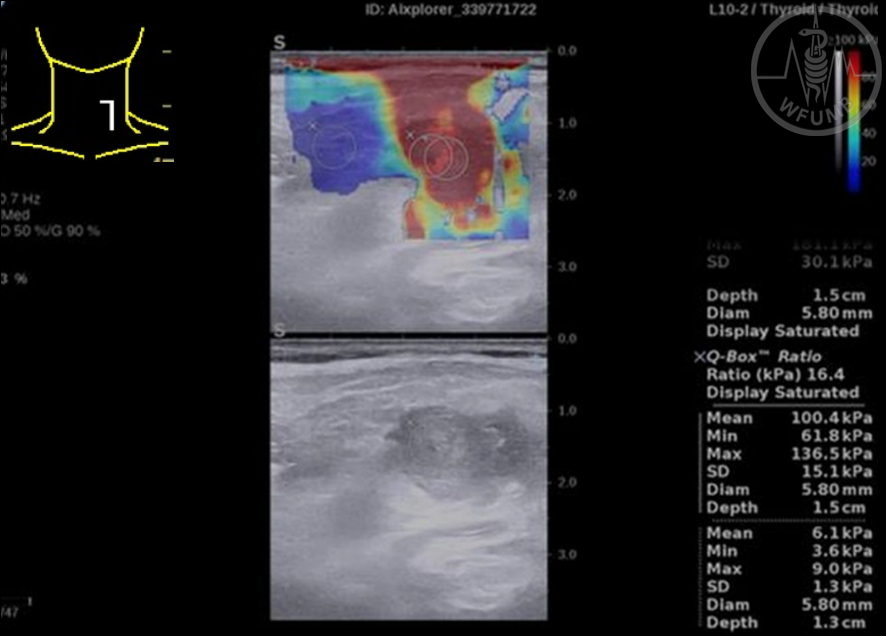
Fig 33.28
High risk thyroid nodule in gray scale US: solid pattern, intense hypoechoic, irregular margins, inhomogeneous. 2D-SWE (Mac 30 Aixplorer) color code 4 – increased stiffness - upgrade to very high category. Mean elasticity = 100.4 kPa. Strain Ration = 16.4
Fig 33.29
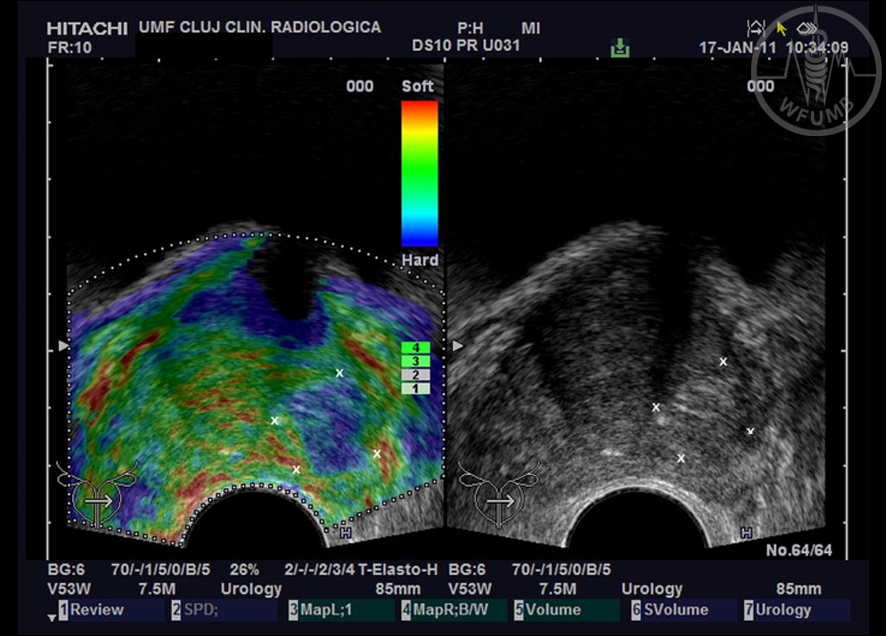
SE of a hyperechoic prostate nodule. Stiffness in the entire hyperechoic nodule is hard, Kamoi score 5, prostate adenocarcinoma
Fig 33.30
SE of a hyperechoic prostate nodule. Stiffness in the entire hyperechoic nodule is soft, benign prostate hypertrophy
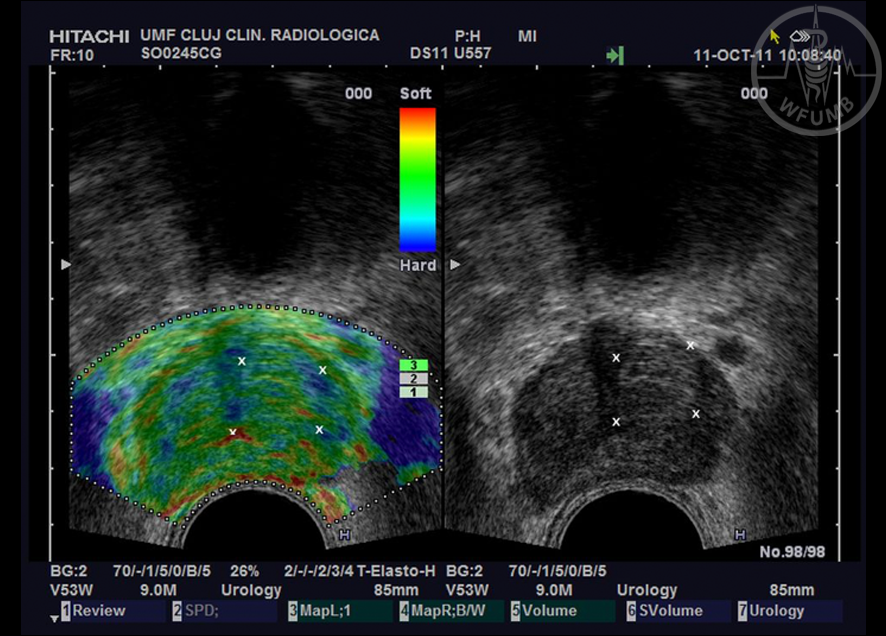
Fig 33.31
2D-SWE of the prostate. Both measured values are higher than 35 kPa. Biopsy should be targeted in the stiffer area (98 kPa)
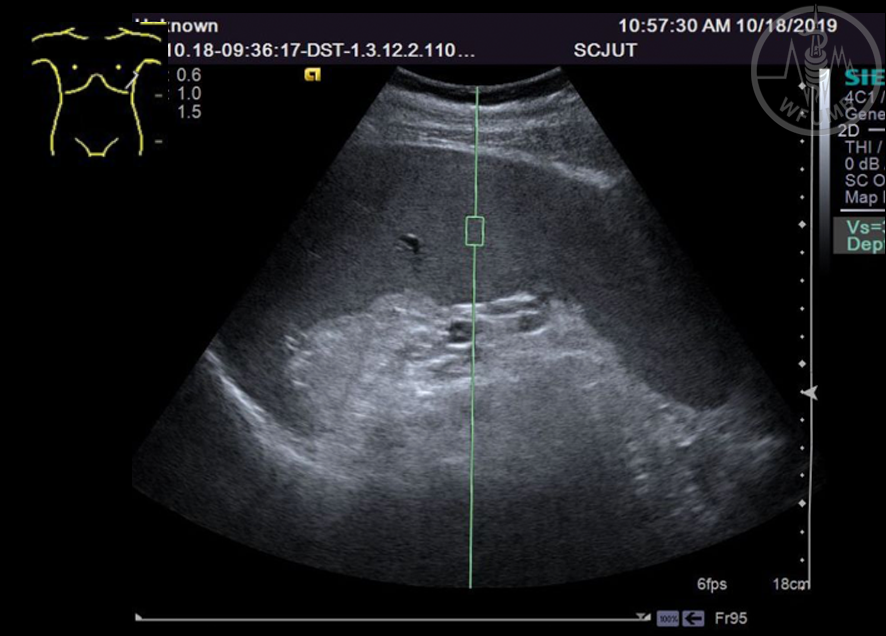
Fig 33.32
Spleen stiffness measurement by pSWE (VTQ technique from Siemens)
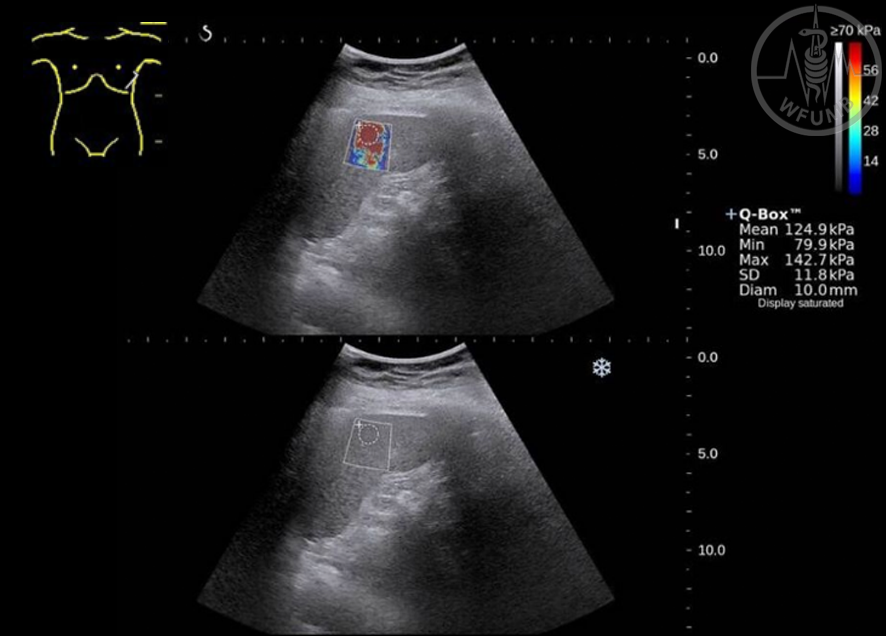
Fig 33.33
Spleen stiffness measurement by 2D-SWE (Aixplorer System from Supersonic Imaging)