Chart Plotting in Pregnancy
Click on the links below.
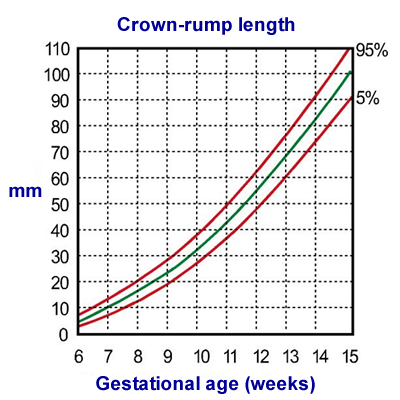
Normal pregnancy
For the most part, the baby’s growth will be about average (the green line). Larger (but normal) babies may grow close to the upper red line (95th centile) while smaller (but normal) babies may grow along or near the lower red line (5th centile). 90% of normal babies will grow between these confines.
When assessing gestational age, we assume that the baby is average and therefore the first graph plot is placed on the green or average line. Thus, if the first crown-rump length (CRL) measurement is 29 mm, we would plot this on the chart. The pregnancy is therefore dated at about 9 weeks and 5 days.
However, there is other information at your disposal. You already know that pregnancy dating is usually based on the mother's last normal period. Usually, the mother’s period dates and the CRL measurement will coincide and then plotting the measurement on the chart is easy, In our case, the mother’s last normal menstrual period was just less than 10 weeks ago – so that fits exactly with how we have plotted the gestational age on our CRL chart.
Click on the links below.
Normal pregnancy
For the most part, the baby’s growth will be about average (the green line). Larger (but normal) babies may grow close to the upper red line (95th centile) while smaller (but normal) babies may grow along or near the lower red line (5th centile). 90% of normal babies will grow between these confines.
When assessing gestational age, we assume that the baby is average and therefore the first graph plot is placed on the green or average line. Thus, if the first crown-rump length (CRL) measurement is 29 mm, we would plot this on the chart. The pregnancy is therefore dated at about 9 weeks and 5 days.
However, there is other information at your disposal. You already know that pregnancy dating is usually based on the mother's last normal period. Usually, the mother’s period dates and the CRL measurement will coincide and then plotting the measurement on the chart is easy, In our case, the mother’s last normal menstrual period was just less than 10 weeks ago – so that fits exactly with how we have plotted the gestational age on our CRL chart.

Click on the links below.
Abnormal pregnancy
Sometimes, the CRL measurement and the mother’s dates do not coincide. This could be due to many reasons.
If our patient presented 12 weeks after her last menstrual period, we would have two choices:
- If her menstrual dates were uncertain, then we would assume that her dates were wrong and plot the chart on the average line
- If her menstrual dates were certain, then we would need to plot the CRL against the 12 week point. From the plot on the chart, it would appear that the baby is too small for the expected date and it implies that there is something wrong. This early in pregnancy, the most likely problem is that the baby has died – so we need to check carefully for the fetal heart
Once we have established the gestation age, we use that throughout the pregnancy. If on subsequent measurements of the baby it appears either too small or too big, we do not change the gestational age.
In our patient, we measured the CRL again 2 weeks later when the CRL measured 52 mm. The plot on the chart fits with normal growth. If the second measurement after 2 weeks is only 35 mm, we will not plot this new measurement along the average line as we know she should be nearly 12 weeks pregnant. We should therefore plot the new measurement against 12 weeks.
Now it looks as if there is something wrong. The baby is too small for 12 weeks and may have died within the uterus.
Reasons why the CRL chart measurement may not be accurate
The mother:
- Is unsure of her dates
- Could have become pregnant while breast feeding, before normal cycle re-established
- Could have irregular periods
- May have forgotten the dates
Or there may be something wrong with the pregnancy.
Click on the links below.
Abnormal pregnancy
Sometimes, the CRL measurement and the mother’s dates do not coincide. This could be due to many reasons.
If our patient presented 12 weeks after her last menstrual period, we would have two choices:
- If her menstrual dates were uncertain, then we would assume that her dates were wrong and plot the chart on the average line
- If her menstrual dates were certain, then we would need to plot the CRL against the 12 week point. From the plot on the chart, it would appear that the baby is too small for the expected date and it implies that there is something wrong. This early in pregnancy, the most likely problem is that the baby has died – so we need to check carefully for the fetal heart
Once we have established the gestation age, we use that throughout the pregnancy. If on subsequent measurements of the baby it appears either too small or too big, we do not change the gestational age.
In our patient, we measured the CRL again 2 weeks later when the CRL measured 52 mm. The plot on the chart fits with normal growth. If the second measurement after 2 weeks is only 35 mm, we will not plot this new measurement along the average line as we know she should be nearly 12 weeks pregnant. We should therefore plot the new measurement against 12 weeks.
Now it looks as if there is something wrong. The baby is too small for 12 weeks and may have died within the uterus.
